Building dashboards no longer requires coding skills or hiring developers. With no-code platforms, anyone - from marketers to business analysts - can create professional dashboards quickly and affordably. These tools offer drag-and-drop interfaces, seamless data integrations, and interactive features that simplify the process of turning raw data into actionable insights.
Key Takeaways:
- Save Time and Money: No-code platforms reduce dashboard creation time from weeks to hours and cost significantly less than traditional methods.
- Ease of Use: Drag-and-drop tools make it simple for non-technical users to build dashboards.
- Data Integration: Connect directly to sources like Google Sheets, Airtable, or SQL databases.
- Customization: Design layouts, add filters, and create visuals without coding.
- For Everyone: Ideal for small businesses, data analysts, and non-technical teams.
Platforms like Adalo, Glide, and Softr offer pricing starting as low as $36/month, making them accessible for businesses of all sizes. By leveraging these tools, you can create dashboards that provide real-time insights and empower faster decision-making.
Read on for step-by-step guidance on choosing a platform, connecting your data, and designing dashboards that work for your needs.
How to Build a No Code Dashboard
To get started without a budget, you can explore various free low code platforms that offer robust dashboarding capabilities.
sbb-itb-33eb356
Why Build Dashboards With No-Code Platforms?
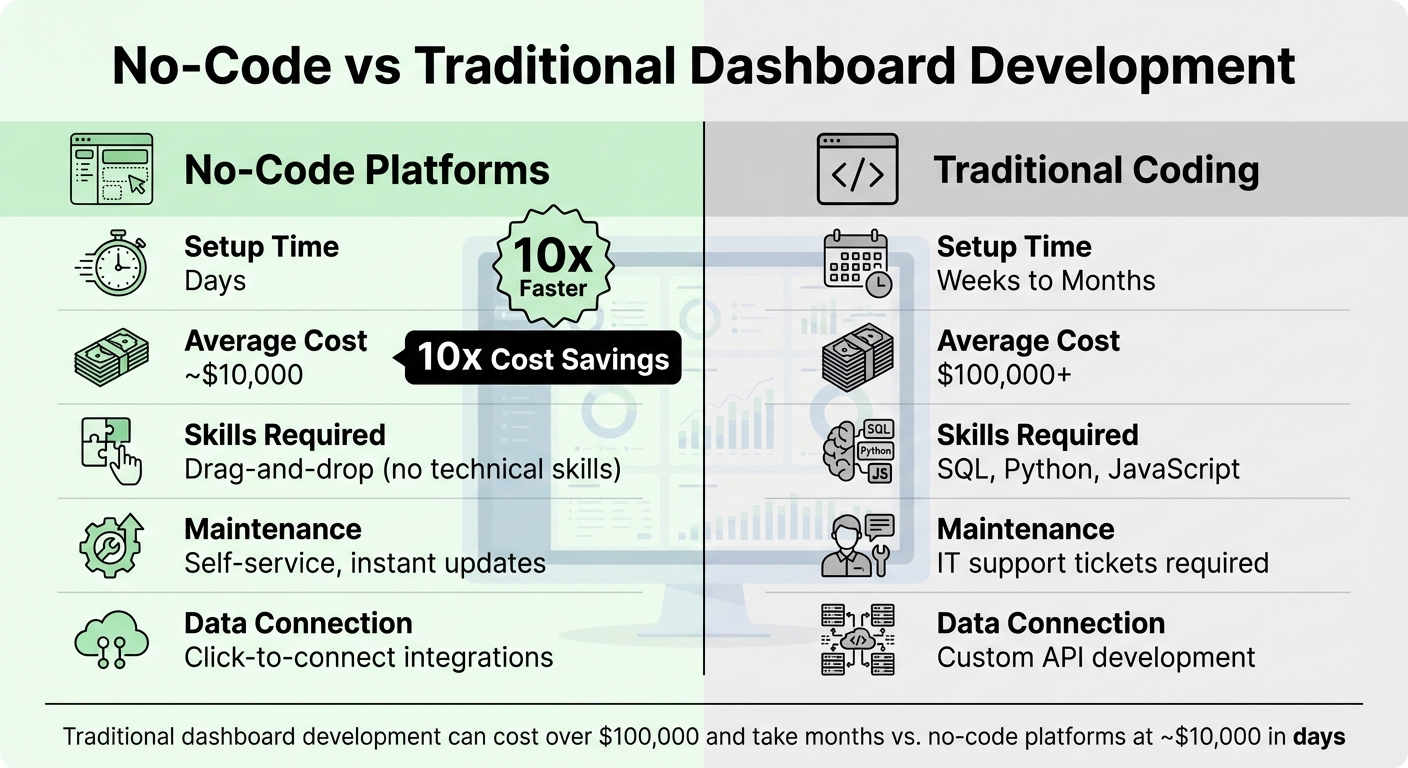
No-Code vs Traditional Dashboard Development: Cost, Time and Skills Comparison
The benefits of using no-code platforms for dashboard creation are hard to ignore. Traditional dashboard development can cost companies over $100,000 and take months to complete. In contrast, no-code platforms deliver professional dashboards at a fraction of the cost - roughly one-tenth - and in a fraction of the time.
The time savings are a game-changer. What once required weeks or months can now be accomplished in days, or even hours. Take ITV, for example. Using Glide, they enabled over 40 teams to track cloud spending across their portfolio. Marc Walford, Head of FinOps at ITV, shared:
"I try to make the interface as clean as possible when you log in. It organizes the most relevant data quickly without clicking and searching".
Traditional coding methods simply can’t match this level of efficiency.
But it’s not just about speed and cost. No-code platforms also make it possible for almost anyone to create professional-grade dashboards without needing programming expertise. Whether it’s a marketing manager building a campaign performance tracker, a sales team visualizing pipeline metrics, or a finance department monitoring budgets, no-code tools remove IT bottlenecks and empower teams to take control of their data.
Main Benefits of No-Code Dashboards
Here are some standout features that make no-code dashboards so effective:
- Ease of use: Drag-and-drop interfaces let users arrange charts and graphs without any coding knowledge.
- Instant data connections: Many platforms integrate seamlessly with tools like Google Sheets, Airtable, SQL databases, and CRMs. For instance, Zapier’s accounting team used Stacker to build a tool that directly connects to their data sources.
- Self-service maintenance: Users can update metrics or visualizations instantly, eliminating the need for IT support or lengthy development cycles.
- AI-assisted tools: Platforms like Adalo’s "Magic Start" can create a dashboard framework from plain-English instructions, setting up the structure, database, and basic visuals automatically.
| Feature | No-Code Platform | Traditional Coding |
|---|---|---|
| Setup Time | Days | Weeks to Months |
| Average Cost | ~$10,000 | $100,000+ |
| Skill Required | Drag-and-drop | SQL, Python, JavaScript |
| Maintenance | Self-service, instant | IT support tickets |
| Data Connection | Click-to-connect | Custom API development |
Who Should Use No-Code Dashboards?
The versatility of no-code dashboards makes them suitable for a wide range of users.
For small business owners, these platforms offer an affordable way to track revenue, expenses, and customer metrics. With pricing starting as low as $36/month (Adalo) or $49/month (Softr), even businesses with tight budgets can access professional dashboards.
Data analysts benefit from the speed these platforms provide. Instead of spending days coding visualizations, they can connect data sources and build dashboards in hours - freeing up time for deeper analysis. For example, Segment used Stacker to create an app for over 15,000 startups. This app allowed members to log in, track software deals, and access resources, all powered by data stored in Airtable.
Non-technical teams in sales, HR, and operations also gain newfound independence. A sales director can quickly visualize pipeline conversion rates, or an HR manager can track hiring metrics - all without waiting on IT. This means the people closest to the data can make faster, more informed decisions.
How to Choose a No-Code Dashboard Platform
Picking the right no-code platform can be daunting. The key is to focus on your specific needs instead of being swayed by the lowest price or the platform with the longest feature list. For instance, a tool that excels at tracking internal metrics might not be the best choice for creating a customer-facing analytics portal.
What to Look for in a Platform
Start by ensuring the platform connects to your data sources without a hitch. Whether you're working with Google Sheets, Airtable, SQL databases, or APIs, seamless integration is critical. Around 80% of teams analyze data from multiple sources, so make sure the platform supports all the ones you use. During a free trial, test it with your actual data to confirm the numbers match your existing reports and that the platform can handle your data volume without performance issues.
Next, evaluate the platform’s visualization and interactivity features. Does it support the chart types you need, such as bar graphs, line charts, scatter plots, or heatmaps? About 75% of modern dashboards now include interactive drill-down features - determine if these align with your decision-making process. A drag-and-drop interface that supports custom branding and is optimized for mobile and desktop devices is another must-have.
Pricing is another factor to scrutinize. Beyond the monthly subscription cost, watch out for usage-based fees like "Workload Units", API call limits, or record caps that can lead to unexpected charges as your data scales. For example, Bubble starts at $69/month but includes limits based on Workload Units, while Adalo offers unlimited records on paid plans starting at $36/month. Be mindful of additional costs such as middleware tools (e.g., Zapier at $19.99/month), database hosting, or transaction fees.
After connectivity and visualization, consider how the pricing model and security features align with your business needs.
To help you compare, here’s a quick breakdown of popular platforms:
| Platform | Starting Price | Database Limits | Usage Charges | Best For |
|---|---|---|---|---|
| Adalo | $36/month | Unlimited on paid plans | None | Teams needing predictable costs |
| Bubble | $69/month | Limited by Workload Units | Yes | Complex web applications |
| Glide | $60/month | Limited rows | Yes | Simple spreadsheet-based dashboards |
| Softr | $167/month | Limited per app/source | Yes | Operational dashboards on SaaS data |
Lastly, don’t overlook security. Look for platforms with robust access controls like granular permissions, user roles, and secure login options. Data security is a top priority for 44% of BI professionals when selecting platforms. Ensure the platform allows data export to avoid being locked into a tool that may not meet your future needs.
Finding Platforms With the Low Code Platforms Directory
Once you know your requirements, the Low Code Platforms Directory can simplify your search. It lets you filter tools based on technical needs like data source compatibility, automation, or CRM integration, saving you from sifting through dozens of options.
This directory helps you avoid common missteps, such as picking platforms without data export options or those with inadequate documentation. It also highlights technical capabilities like user load handling and tool integration, which are crucial for many teams. By using this resource, you can quickly zero in on platforms that meet your needs without wasting time testing tools that fall short.
How to Build Your Dashboard: Step-by-Step
Step 1: Set Up Your Account and Connect Your Data
Start by connecting your data sources through your platform's integration options. Most proprietary low code platforms offer support for cloud spreadsheets, SQL databases, and third-party APIs.
The connection process depends on the type of data. For example, spreadsheets often use one-click connectors, giving you access within seconds. For production databases like BigQuery or Snowflake, you'll need to input specific details like the host name, port number, and credentials. API integrations typically require you to paste in your API key for access. Many tools also allow you to upload CSV or Excel files if you're looking for a quick setup.
Make sure your data is clean and consistent before proceeding; dashboards depend on reliable input. Some platforms, such as Stacker and Glide, even offer two-way syncing, meaning any changes you make on the dashboard can automatically update the original data source.
Tools like Rows simplify the connection process further by using AI. For instance, you can use natural language prompts like "Import my last 30 days of traffic" to streamline the setup process. Chris Tweten, CMO at Spacebar Collective, shared:
"With Rows, our reports are automated and much more detailed. We no longer need to copy and paste data from GSC or GA4."
Once your data is connected, you're ready to design the layout of your dashboard.
Step 2: Design Your Dashboard Layout
With your data in place, it's time to create a layout that emphasizes your key metrics. Use the platform's drag-and-drop tools to arrange widgets, charts, and filters on your dashboard. Place the most critical metrics - like revenue, churn rate, or customer count - at the top for quick visibility. This approach creates a clear visual hierarchy, making it easier for users to interpret data at a glance.
Group related metrics together for better organization. For example, keep marketing KPIs like ad spend, conversion rates, and cost per acquisition in one section, while operational metrics like inventory levels and order fulfillment times go in another. A well-organized layout ensures users can find the information they need without sifting through clutter.
Keep the design clean and simple. Limit font and color variations, and use high-contrast colors to differentiate data sets. For example, ITV used bar graphs with distinct colors to help over 40 teams monitor cloud spending and spot overages in real time.
Consider adding tabs to separate different data views. For instance, an "Overview" tab can display high-level KPIs, while a "Trends" tab can focus on detailed time-series data. This approach prevents information overload and keeps the interface user-friendly. If you're unsure where to start, many platforms provide pre-made templates tailored to common needs like Sales, Operations, or Finance dashboards. These templates often come with pre-built database structures and layouts.
Step 3: Customize Visualizations and Add Interactivity
Once your layout is complete, customize each chart to suit your specific needs. Use line charts to display trends over time, bar charts for comparisons, and KPI tiles for single, high-level metrics. Match your brand's color scheme and adjust labels for clarity - avoid using technical jargon or abbreviations that might confuse your audience.
Adding interactivity can transform your dashboard from static visuals into a dynamic decision-making tool. Most platforms allow you to implement event handlers or actions. For instance, you can set up a "Select" event on a bar chart so that clicking on a specific region filters data across all other visuals. Drill-down features can also be added, letting users click on a summary metric to view detailed data without navigating away from the main dashboard.
Global filters, like date range selectors or dropdown menus, should be placed at the top of your dashboard. These filters should be tied to your data queries so that any changes update all visualizations simultaneously. You can also add actionable buttons directly within table rows, such as "Approve", "Edit", or "Delete", allowing users to act on the data in real time.
Some platforms even support AI-driven interactivity, enabling you to use natural language prompts like "Make my category bar chart filter the orders table when clicked." For mobile-friendly dashboards built with tools like Adalo, you can include push notifications to alert team members when a metric crosses a specific threshold. To keep your data current, set up automatic refreshes - hourly or daily - so your team always has the latest figures.
Following these steps will set you up for success as you move on to testing, publishing, and sharing your dashboard.
Testing, Publishing, and Sharing Your Dashboard
Test Your Dashboard on Different Devices
Once your dashboard is designed and customized, the next step is to ensure it performs flawlessly. Start by verifying the accuracy of your data. For instance, if your dashboard displays $125,000 in total revenue, cross-check this figure with your CRM or data source using a simple calculation like =SUM().
Interact with every filter, button, and drill-down feature to confirm that all joins and calculations function as expected. As Spencer Lanoue from Bricks puts it:
"A dashboard with incorrect data is worse than no dashboard".
Use Performance Analyzers to check that your dashboard loads quickly - ideally within 10–15 seconds. Test its performance across a range of devices, including smartphones, tablets, and desktops, as well as different browsers like Chrome, Firefox, and Edge. This ensures a consistent experience for all users.
If your dashboard uses Row-Level Security, use the "View as" option to confirm that data restrictions are applied correctly. Finally, conduct User Acceptance Testing (UAT). Ask stakeholders to use the dashboard to answer specific business questions. This process can uncover confusing workflows or highlight missing features before the dashboard goes live.
How to Publish and Share Your Dashboard
After thorough testing, it's time to prepare your dashboard for publication. Start by cleaning up its structure: hide any unused worksheets and rename tabs with clear, descriptive titles like "Monthly Sales" instead of generic ones. Choose a hosting environment that aligns with your data's sensitivity and security requirements.
Next, decide on your data connection strategy. A "Live" connection provides real-time data updates, while an "Extract" offers faster performance. If you go with extracts, set up automated refresh schedules - whether hourly, daily, or weekly - to keep your data up-to-date without manual effort. Apply Row-Level Security or visibility rules to ensure users only access the data they're authorized to see.
For integration, embed your dashboard into company platforms like SharePoint, Notion, or Confluence using iframe codes. You can also configure automated notifications through tools like Slack or Gmail to alert users when key metrics hit certain thresholds. Some platforms even let you publish dashboards as native apps available on the Apple App Store or Google Play Store.
When sharing your dashboard with external stakeholders, use secure, time-limited links to prevent unauthorized access. For instance, Datadog’s magic links offer read-only access for 30 days after a one-hour validation period. Alternatively, restrict access to specific corporate domains (e.g., @company.com) and require users to request access through an automated authentication link. Lastly, save your dashboard with the primary tab active so users see the most important data first when they open it.
Conclusion
Creating dashboards without writing code is no longer an unattainable goal for organizations with smaller IT budgets. By linking your data sources, using drag-and-drop tools to design layouts, and including interactive filters, you can turn raw data into actionable insights in just a few hours. These no-code platforms address common decision-making challenges by providing real-time access to reliable data.
What makes these tools stand out is their ability to empower users without technical expertise. Now, anyone can build professional-grade dashboards that used to require dedicated data teams. For instance, ITV uses no-code platforms to track cloud spending across 40 teams, while Zapier's accounting department relies on them to manage employee budgets. As Wren Noble, Head of Content at Glide, explains:
"Dashboards help you visualize your data in a more humanistic way, so you can more easily see trends, identify problems, and make data-driven decisions".
Selecting the right platform is essential to unlocking these advantages. Platforms differ significantly in how they handle data, their pricing models, and the types of dashboards they produce, ranging from mobile apps to web-based portals. The Low Code Platforms Directory (https://lowcodeplatforms.org) offers a helpful comparison tool, allowing you to filter options based on features like AI capabilities, database integration, and costs. This resource simplifies the process of navigating a market where pricing can vary from $36/month to over $167/month, depending on your requirements.
To make the most of these tools, start by defining your key performance indicators (KPIs), test your dashboards across devices, and refine them using user feedback. With this approach, you can turn your data into decisions that drive meaningful outcomes.
FAQs
Which no-code dashboard tool fits my data sources and use case?
The right no-code dashboard tool for you depends on your data sources and what you aim to achieve. If you're working with live data connections - like Google Sheets, Airtable, or SQL - tools such as Rows, Glide, or WeWeb are worth exploring. For those seeking AI-powered insights, Noloco stands out as an excellent option. On the other hand, if your focus is on spreadsheet-based data, platforms like Adalo and WeWeb offer robust customization capabilities. Your choice should align with the integrations and features that best suit your workflow.
How do I keep my dashboard data accurate and up to date?
To keep your dashboard data accurate and current, link it to live data sources that allow automatic updates. Plenty of no-code platforms offer real-time data integration and scheduled updates, cutting down on manual work. Look for tools with easy-to-use visual settings for adjusting refresh intervals, ensuring your data stays up to date without the hassle of outdated information.
How can I control who sees what data in a shared dashboard?
You can manage who sees what in shared dashboards by leveraging the platform's permission and access controls. Many no-code tools come equipped with features like role-based permissions, user authentication, and login-based access. These tools let you limit data visibility so that only authorized users can access specific data or interact with particular dashboard elements. This ensures sensitive information stays protected and only reaches the right audience.