Slow dashboards lose users. If your embedded analytics take too long to load, users will abandon them and revert to manual processes. But optimizing performance isn’t just about speed - it’s about delivering actionable insights without frustrating delays. Here’s what you need to know:
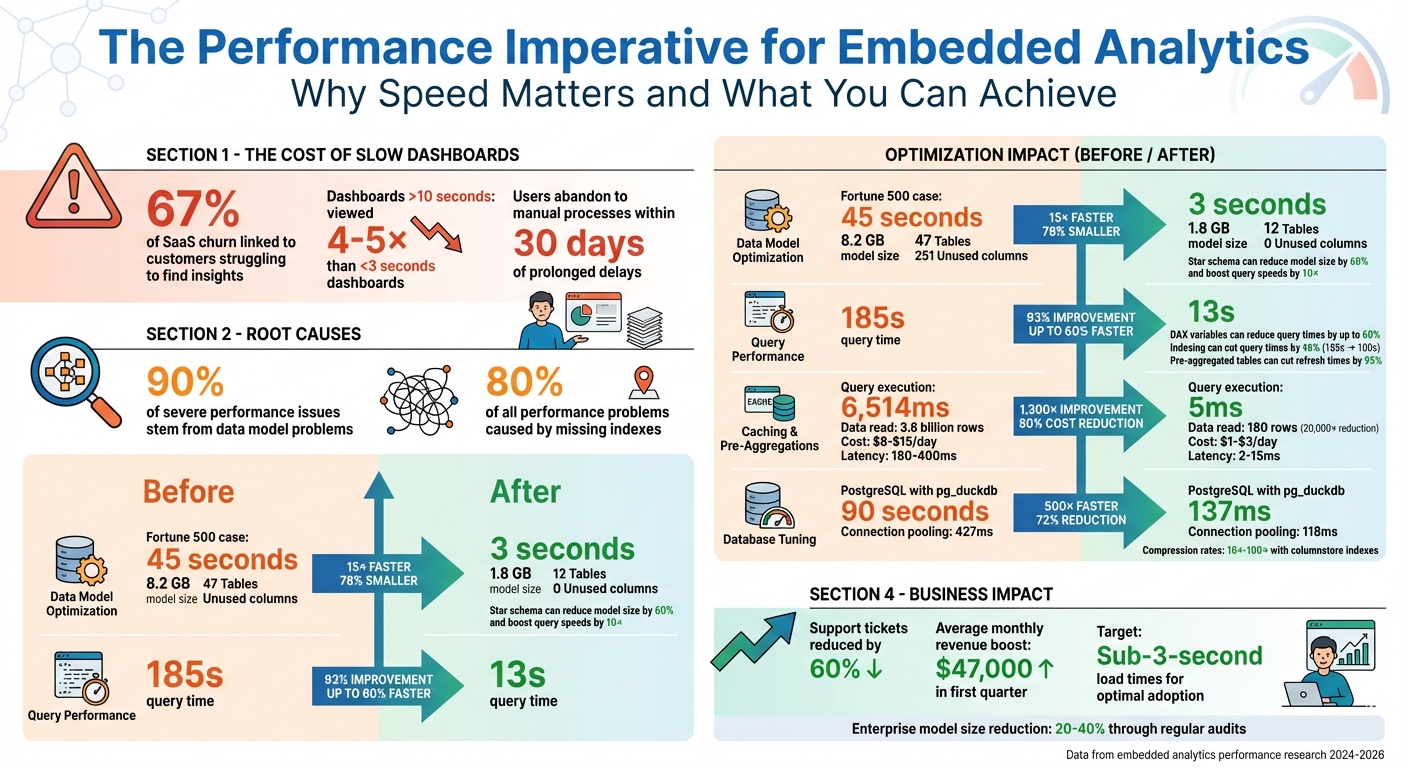
- Data models: Simplify them. Switch to a star schema, remove unused columns, and reduce cardinality. For example, a Fortune 500 company cut dashboard load times from 45 seconds to 3 seconds by restructuring their data model.
- Query performance: Use early filtering, indexing, and pre-aggregated summary tables to speed up complex queries. Pushing calculations upstream can reduce query times by up to 60%.
- Caching and pre-aggregations: Implement multi-layer caching and pre-aggregate data to cut query execution times dramatically - sometimes by 1,300x or more.
- Report design: Limit visuals to 8–12 per page, use native visuals, and apply "Top N" filters to avoid overwhelming the system.
- Infrastructure and database tuning: Optimize indexes, use connection pooling, and consider read replicas to handle high concurrency. Proactively monitor performance metrics to identify bottlenecks.
Embedded Analytics Performance Optimization: Key Statistics and Impact Metrics
Enhancing Embedded Analytics with Hierarchies, Drilldowns & Dashboard Linking
sbb-itb-33eb356
Streamlining Data Models and Queries
The backbone of fast embedded analytics lies in how you structure and query your data. Interestingly, 90% of severe performance issues in analytics stem from problems with data models. So, getting this part right can make a massive difference. As Rashidbek, a data professional, puts it:
"The single biggest lesson I have learned is that performance problems are almost never caused by a single issue. Slow reports are the result of compounding inefficiencies." - Rashidbek, Data Professional
Let’s dive into ways to simplify models and optimize queries for better speed.
Simplify Data Models
Switching to a star schema can be a game-changer. This approach uses fact tables for numeric measures and dimension tables for descriptive attributes, which helps streamline the model. A single adjustment like this can shrink model size by 60% and boost query speeds by 10x. For example, in 2026, a Fortune 500 manufacturing company serving over 500 plant managers faced frustrating 45-second dashboard load times. Their snowflake schema, with 47 tables and 12 bidirectional relationships, was the culprit. By flattening it into a star schema with just 12 tables and removing 251 unused columns, they slashed the model size from 8.2 GB to 1.8 GB and cut load times from 45 seconds to just 3 seconds.
Regular audits - preferably quarterly - are essential to maintain lean models. Removing unused columns and disabling "Auto Date/Time" can reduce enterprise model sizes by 20-40%.
For better compression and performance, reduce cardinality. Break high-precision DateTime columns into separate Date and Time fields, round decimals to the required precision, and use numeric types for IDs. Once your data models are optimized, it’s time to focus on improving query performance.
Optimize Query Performance
Start by applying early filtering. Push WHERE clauses directly to the data source to minimize the number of rows processed. Indexing frequently filtered columns can cut query times by 46% - for instance, reducing a query from 185 seconds to 100 seconds. Combine this with server and partition improvements, and load times can drop to just 13 seconds.
Avoid using high-cardinality fields in filters or group-bys, as they can slow down compression and aggregation. For complex calculations, use DAX variables (VAR/RETURN), which can reduce query times by up to 60%. Whenever possible, push row-level calculations upstream to the source database or ETL process instead of handling them in the analytics layer. As Tableau’s documentation wisely notes:
"If a query is slow in the data source, it will be slow in Tableau." - Tableau Documentation
For massive datasets - think over 100 million rows - pre-aggregated summary tables are your best friend. Combine these with incremental refresh settings to update only new or changed data, cutting refresh times by as much as 95%.
Using Caching and Pre-Aggregations
After streamlining your data models and queries, the next step is implementing caching and pre-aggregations. These techniques shift data processing from the moment a user interacts with a dashboard to the time when data is initially ingested. This approach reduces the processing time users experience, ensuring analytics remain fast and responsive. As Nauman Hayat from Embeddable puts it:
"Pre‑aggregations change the unit of work. Instead of counting from raw events every time, you do the math once and serve the answer many times." - Nauman Hayat, Author, Embeddable
The impact of pre-aggregations can be dramatic. In one benchmark using Cube with a Postgres database, query execution time dropped from 6,514ms to just 5ms - a staggering 1,300x improvement. For a query analyzing 180 days of Daily Active Users, pre-aggregations reduced the data read from 3.6 billion event rows to just 180 rows, cutting the workload by up to 80,000x.
Implement Caching Strategies
A multi-layer caching system can provide the best performance. Here's how to structure it:
- L1 in-memory LRU caches: These handle sub-millisecond lookups locally.
- L2 Redis layers: Useful for distributed systems.
- L3 database-level persistent caches: Serve as the foundation for long-term storage.
This tiered setup ensures frequently accessed data is always close to users, minimizing delays.
The cost savings are just as impressive. A production RAG system handling 50,000 queries daily could cost $8–$15 per day in API fees without caching. With caching, that drops to $1–$3, representing an 80% cost reduction. Cached lookups also achieve latencies of just 2–15ms compared to 180–400ms for uncached queries. A developer from Grizzly Peak Software highlights the value:
"The benefit is clear: you spend a small amount of memory and storage to avoid redundant API calls. In every production system I have built, this pays for itself within the first day." - Author, Grizzly Peak Software
To optimize cache hit rates, normalize cache keys before hashing. This means collapsing whitespace, converting text to lowercase, and removing trailing punctuation. Always include the model name in your cache key hash to ensure keys automatically update when models change.
Once caching is in place, pre-aggregations can take your performance gains even further by storing computed summaries.
Apply Pre-Aggregations
Pre-aggregations work by materializing query results into a separate, high-performance layer. Modern semantic layers can automatically check incoming queries against pre-aggregations. If a match exists, the raw data source remains untouched.
For time-series data, consider partitioning data into daily or monthly chunks. This allows for incremental updates, where only the most recent data is refreshed, saving both time and warehouse costs. When designing indexes for pre-aggregations, prioritize dimensions used in high-selectivity single-value filters, followed by those used in GROUP BY clauses.
To control costs, enable "rollup-only" mode in production. This ensures only pre-aggregated data is queried, avoiding expensive scans of your data warehouse. Instead of mirroring your source database structure, design pre-aggregations around the specific questions users ask most frequently. For multi-tenant applications, align rollups with common keys like tenant ID, plan, or region to minimize unnecessary processing.
Optimizing Report Design and Embedding
Once caching and pre-aggregations are in place, the next step is refining report design and embedding methods. Even the most optimized data layer can be slowed down by cluttered dashboards or inefficient embedding techniques. As Jessie G, a Business Intelligence Developer at The Reporting Hub, aptly puts it:
"A cluttered report is a slow report. Limit the number of visuals to those that truly matter." - Jessie G, Business Intelligence Developer, The Reporting Hub
Design choices impact not only performance but also user satisfaction. In fact, 67% of SaaS churn is linked to customers struggling to find the insights they need. Streamlined embedded analytics can reduce support tickets by 60% and generate an average monthly revenue boost of $47,000 within the first quarter. By combining optimized data models with thoughtful report layouts and embedding practices, you can achieve even greater performance gains.
Simplify Report Layouts
Every visual on a report generates its own query. A dashboard with 25 visuals? That’s 25 simultaneous queries - and adding slicers means all 25 queries re-fire with every interaction. To improve performance, limit each page to 8–12 visuals.
Not all visuals are created equal when it comes to performance costs. Each type has a "unit weight" that affects rendering speed:
- Geo maps and value driver trees: 1.0 unit
- Tables: 0.6 units
- Expanded filters: 0.4 units
- Standard charts: 0.3 units
For the best browser performance, keep the total widget weight on a single page under 5 units. Additionally, native visuals are faster than custom ones, thanks to fewer inefficiencies. For background images, use compressed formats like SVG or PNG and keep file sizes under 1MB to reduce load times.
To further optimize, apply "Top N" filters to limit charts and tables to 500 or fewer data points. Also, collapse page filters and input controls by default - expanded controls refresh frequently, slowing down reports, especially when working with high-cardinality dimensions.
By reducing visual counts, managing widget weights, and streamlining layouts, you can cut down on query volume and improve the user experience. Once your report design is optimized, the next step is to refine embedding practices.
Improve Embedding Practices
Embedding analytics effectively is just as important as optimizing the reports themselves. Proper embedding ensures the performance gains from caching and pre-aggregations carry over to embedded reports.
Here are some best practices:
- Reuse a single iFrame when switching between reports or displaying multiple visuals. This avoids the overhead of repeated initialization.
- Use
powerbi.preload()to load JavaScript and CSS files before users navigate to the report. The bootstrap API can prepare and initialize the iFrame in parallel with back-end embedding calls, cutting load times. - If interactivity isn’t needed, embed dashboard tiles instead of full reports. Tiles are lighter, load faster, and are ideal for high-level summaries.
- Save reports with filters, bookmarks, and slicers already applied. This ensures visuals load using cached data rather than executing new queries.
- Limit embed configurations to "View" permissions if editing isn’t required. This prevents unnecessary components from loading.
Database and Infrastructure Tuning
When aiming for peak performance, database and infrastructure tuning ensures every layer of your system operates efficiently. Even with well-optimized reports and embedding practices, your database and infrastructure can still create bottlenecks. As Emily Watson, a Technical Writer and Developer Advocate, points out:
"Your database is probably the bottleneck... missing indexes [are] 80% of all performance problems." – Emily Watson, Technical Writer and Developer Advocate
The silver lining? Strategic indexing can slash query times by up to 85%, while properly configured connection pools can cut transaction times by 72% - dropping from 427 ms to just 118 ms. Together, database tuning and infrastructure scaling ensure your embedded analytics can handle growing data volumes and user demands without compromising responsiveness.
Database Optimization Techniques
Analytics queries often sift through massive datasets and execute complex operations, requiring significant memory. For instance, on a server with 64 GB of RAM, it's recommended to allocate shared_buffers=16 GB, effective_cache_size=48 GB, and at least 1 GB work_mem per session. These settings help manage sorts, joins, and aggregations more efficiently, reducing the chances of disk spills.
Indexing is another game-changer. Use BRIN indexes for large, ordered time-series data, covering indexes with the INCLUDE clause for multi-column queries, and GIN indexes to speed up full-text and JSONB searches.
Partitioning large tables by date range or region can also improve performance. This approach enables partition pruning, where the database skips irrelevant data segments during queries. Tools like pg_partman can automate the management of time-series partitions, saving you from manual overhead.
For PostgreSQL-based embedded analytics, extensions like pg_duckdb convert row-based storage into columnar storage. The results are impressive - a TPC-DS query that takes 90 seconds in standard PostgreSQL can be completed in just 137 milliseconds with this extension, delivering a roughly 500× speed improvement. For systems using SSDs, setting random_page_cost to ~1.1 and effective_io_concurrency to 200 helps maximize hardware throughput.
To fine-tune queries, use EXPLAIN ANALYZE to examine query plans and locate inefficiencies like sequential scans. Pre-aggregating frequently used calculations through materialized views is another way to save time. These views can be refreshed during off-peak hours to avoid disrupting active users.
Once your database is optimized, aligning your infrastructure settings ensures sustained performance across the board.
Infrastructure Scaling and Monitoring
Database optimizations work best when paired with effective connection management. Each PostgreSQL connection uses about 5–10 MB of RAM. Without connection pooling, high connection counts can overwhelm resources, causing excessive context-switching. Tools like PgBouncer, when set to transaction mode, help prevent connection exhaustion and reduce overhead.
Read replicas are another critical tool. They offload heavy analytical queries from the primary database, maintaining performance even during high-volume updates. For teams handling medium-sized datasets (100 GB to 10 TB), scaling up can eliminate the latency caused by network coordination in distributed systems, which typically ranges from 500 ms to 1 second.
Proactive monitoring is key. Set alerts for CPU and memory usage at 80% capacity to scale resources before performance dips. Aim to maintain a cache hit ratio above 99% - anything lower could signal the need for additional RAM. Extensions like pg_stat_statements are invaluable for tracking execution statistics and pinpointing slow queries for optimization.
Schedule demanding refreshes and complex queries during off-peak hours. For parallel query execution, configure max_parallel_workers_per_gather and max_parallel_workers to match the number of CPU cores. As Fionce Siow from Redis explains:
"Once systems hit high CPU utilization, query times tend to increase exponentially beyond that threshold." – Fionce Siow, Redis
Monitoring and Continuous Improvement
Once you've fine-tuned your data models and infrastructure, the work doesn't stop there. Ongoing monitoring and gathering feedback are key to maintaining performance over time. With continuous monitoring and user feedback, you can create a system that identifies new bottlenecks before they impact your users. Without tracking the right metrics, diagnosing performance issues - like whether a slow report is due to inefficient DAX queries, network delays, or capacity constraints - becomes guesswork.
Track Performance Metrics
To get a clear picture of where time is being spent, use Performance Analyzer in Power BI Desktop or Service. This tool breaks down visual load times into three categories: DAX query (time spent in the data engine), Visual display (rendering time), and Other (background processes or delays caused by dependencies). This granular breakdown helps pinpoint the visuals causing slowdowns.
For embedded analytics, the Power BI client SDK provides another layer of insight. Events like Loaded (time until the Power BI logo disappears) and Rendered (time until the report is fully visible with data) give you metrics that reflect the user's experience. These metrics help you measure how quickly reports are ready for interaction.
On the backend, Azure Monitor tracks essential engine metrics. For example:
- Engine Execution Time shows how long the data engine spends processing queries.
- Service Queue Time reveals whether users are experiencing delays due to concurrency limits.
Azure Monitor flags resource-heavy queries, such as those consuming over 100 seconds of CPU or spanning more than 15 days of data. Queries exceeding 90 days of data are classified as abusive and may be throttled.
| Tool | Key Metrics | Purpose |
|---|---|---|
| Performance Analyzer | DAX Query time, Visual Display, Other | Identifies slow visuals and rendering issues |
| Power BI Client SDK | Loaded Event, Rendered Event | Measures time to initialize and display reports |
| Azure Monitor | Engine Execution Time, Total CPU, Service Queue Time | Tracks backend performance and concurrency bottlenecks |
| Fabric Capacity Metrics | Resource utilization, Throttling events | Monitors overall infrastructure health and capacity thresholds |
While technical metrics are essential, they only tell part of the story.
Gather User Feedback
Metrics give you numbers, but user feedback provides context. Users can alert you to issues that metrics might miss, like performance problems specific to certain regions, devices, or browsers. By replicating user interactions in Performance Analyzer, you can identify whether delays are caused by DAX queries, visual rendering, or background processes.
Understanding usage patterns also helps refine caching strategies. For instance, if logs show that 95% of queries focus on the past seven days of data, you can configure your hot cache to prioritize that range, delivering faster results for most users. As Nauman Hayat from Embeddable puts it:
"Start from the question, not the table." – Nauman Hayat, Embeddable
This mindset shift - from focusing on tables to focusing on user questions - ensures that pre-aggregations and rollups align with the dimensions users frequently filter by. Tracking which time ranges, filters, and visualizations are most popular allows you to optimize those areas first. You can even export Performance Analyzer logs to JSON for deeper trend analysis and query improvements.
Conclusion
Improving the performance of embedded analytics isn’t about one quick fix - it’s about adopting a structured approach that touches every layer of your stack. Whether it’s simplifying data models, offloading transformations to the database, or leveraging multi-layer caching and pre-aggregations, each tactic plays a role in achieving the coveted sub-3-second load times that keep users engaged. As the ECOSIRE Research and Development Team aptly states:
"Performance is not a technical nicety - it is the difference between BI adoption and BI abandonment."
The impact of speed is undeniable. Dashboards that load in under 3 seconds are viewed 4–5 times more often than those that take over 10 seconds. On the flip side, prolonged delays often push users back to manual processes within just 30 days. Pre-aggregations, for instance, can drastically reduce the data volume your system processes - by factors of 20,000× to 80,000× compared to querying raw events. Similarly, clustered columnstore indexes can deliver compression rates of 10×–100× while significantly boosting query speeds.
But performance optimization isn’t a one-and-done task - it’s an ongoing commitment. As data grows, visuals evolve, and user demands increase, regular audits and constant monitoring with tools like Performance Analyzer become essential. Start by establishing a baseline, identify bottlenecks and slow visuals, apply targeted fixes, and validate your optimizations. This cycle of continuous improvement is what separates dashboards that thrive under scale from those that falter.
Nauman Hayat from Embeddable sums it up perfectly:
"Speed isn't a feature tacked onto dashboards at the end. It's a choice about when and where the math happens".
By making deliberate choices about performance from the start, you’ll ensure your embedded analytics meet user expectations. And in doing so, you’ll not only accelerate dashboards but also unlock the true potential of low-code tools.
For more information on low-code platforms that support powerful embedded analytics, check out the Low Code Platforms Directory at https://lowcodeplatforms.org.
FAQs
What should I optimize first for faster embedded dashboards?
To boost the performance of embedded dashboards, a great first step is using pre-aggregations. These are pre-calculated data summaries that lighten the load on your database by pulling information from pre-processed tables. The result? Faster response times and improved scalability. Focus on setting up pre-aggregations before diving into other optimizations like refining queries or tweaking database settings. They’re particularly useful when handling heavy traffic, offering quicker results right away.
When should I use caching vs pre-aggregations?
Caching and pre-aggregations play distinct roles when it comes to improving the performance of embedded analytics. Caching is ideal for scenarios where you need real-time or near-real-time data access. It works by temporarily storing recent query results, which helps cut down on latency. On the other hand, pre-aggregations are designed to handle repetitive and complex queries more efficiently by storing aggregated data ahead of time. When you combine these two - using caching for up-to-date data and pre-aggregations for resource-heavy queries - you can achieve optimal performance for a wide range of use cases.
How do I find what’s actually causing slow load times?
To figure out what's behind slow load times in embedded analytics, start by enabling slow query logging in your database. For instance, in PostgreSQL, you can use the log_min_duration_statement setting. This will log queries that take longer than a specified threshold - say, 100ms.
Once you have the logs, review them to pinpoint the queries causing delays. Then, use tools like EXPLAIN to dive into execution plans. These plans can reveal bottlenecks such as missing indexes, poorly optimized query structures, or even issues with your schema design. By addressing these specific problems, you can tackle performance delays more effectively.