Performance benchmarking for low-code apps ensures your applications run efficiently, even under heavy user loads. By focusing on key metrics like response times, resource usage, and network efficiency, you can identify bottlenecks and optimize your app for better performance.
Key Takeaways:
- Why it matters: Free low-code platforms simplify development but can hide performance issues. Benchmarking uncovers these before they disrupt users.
- Metrics to track: Prioritize P95 and P99 latency, server response times (<500ms), TTFB (<200ms), and resource usage (CPU <70%, memory <80%).
- Testing essentials: Use realistic environments, test multiple devices, simulate real traffic, and avoid relying on averages - focus on percentiles.
- Tools to use: Platforms like Firebase, New Relic, and Mendix APM help monitor and diagnose performance.
This guide provides a step-by-step framework to measure, analyze, and improve your low-code app's performance, ensuring a smooth experience for users and minimizing costs.
Postman Flows For No Code Performance Testing
sbb-itb-33eb356
Key Performance Metrics for Low-Code Applications
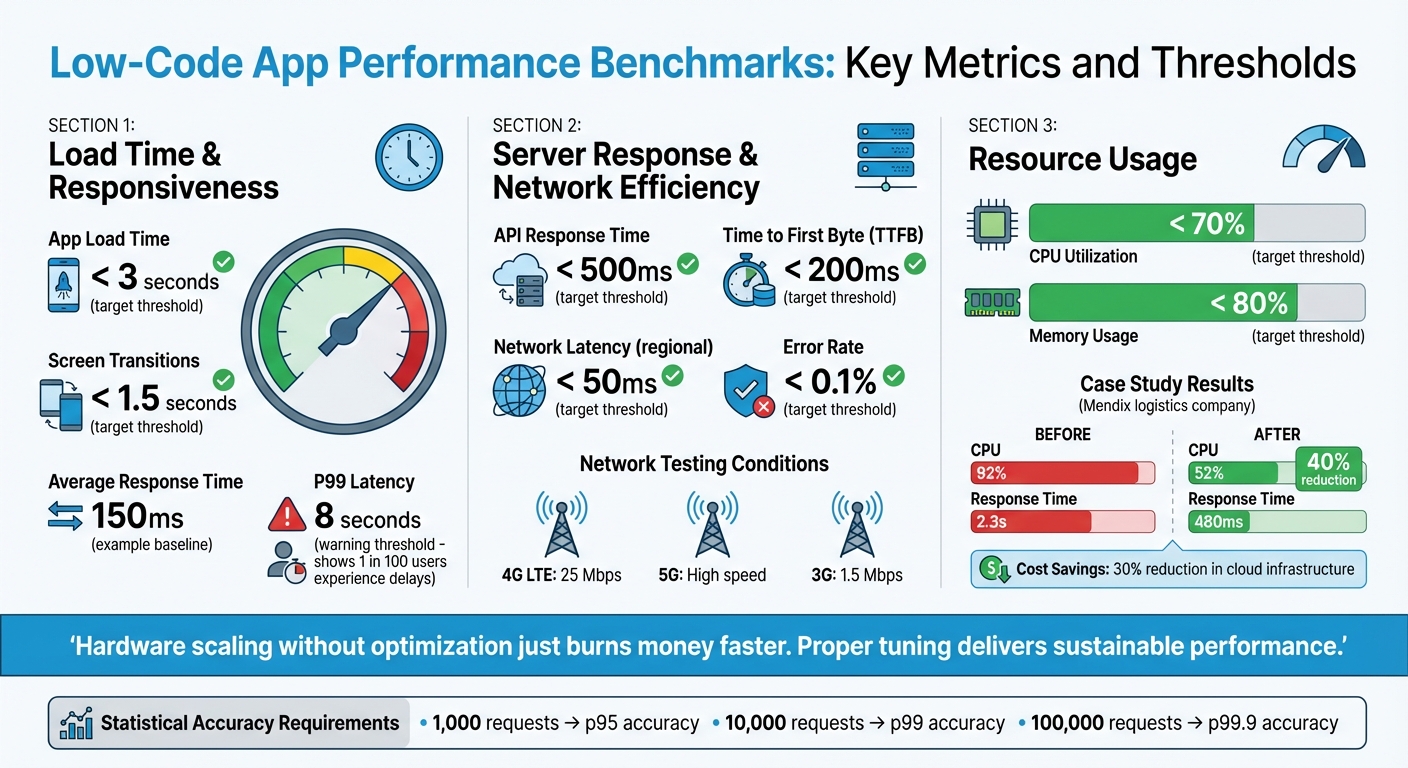
Low-Code App Performance Benchmarks: Key Metrics and Thresholds
When evaluating low-code apps, three metrics stand out: load time and responsiveness, server response and network efficiency, and resource usage. These metrics are essential for ensuring a smooth and reliable user experience.
Load Time and Responsiveness
Load time is critical - users expect apps to load in under 3 seconds, with screen transitions taking no more than 1.5 seconds. Similarly, UI responsiveness tracks the delay between a user's action and the app's feedback, factoring in processes like JavaScript and CSS execution.
To get an accurate picture, look beyond averages. Metrics like P95 and P99 percentiles highlight outliers that can ruin the experience for some users. For example, an app with an average response time of 150ms might seem fine, but if the P99 latency hits 8 seconds, 1 in 100 users could face significant delays.
With load time and responsiveness addressed, the next step is to optimize server and network performance, as these directly impact user interactions.
Server Response and Network Efficiency
Server performance is the backbone of app responsiveness. For a smooth experience, aim for API response times under 500 milliseconds and keep Time to First Byte (TTFB) below 200ms. These benchmarks help pinpoint whether delays stem from server-side processing or network issues.
In server-driven UI setups - like those using platforms such as Digia Studio - JSON payload size becomes a key factor. Larger payloads lead to slower transfers, especially over sluggish networks. Testing your app under realistic conditions (e.g., 4G LTE at 25 Mbps, 5G, or even 3G at 1.5 Mbps) ensures it handles latency and packet loss effectively. Within a specific region, network latency should ideally stay under 50ms.
Another critical metric is the error rate. Under normal conditions, this should remain below 0.1% to avoid disrupting the user experience.
With server and network efficiency in check, the focus shifts to resource usage, which ensures stability under varying loads.
Resource Usage (Memory and CPU)
Efficient resource usage ensures the app performs well across devices, including older ones, and avoids crashes during high traffic. CPU utilization on servers should stay below 70%, leaving enough capacity for unexpected spikes in demand. Similarly, memory usage should remain under 80% and show no upward trend, as this could signal memory leaks.
For Java-based platforms like Mendix, proper JVM tuning can make a significant difference. In one case study, a logistics company faced severe performance issues, with CPU usage at 92% and response times of 2.3 seconds. By using Mendix APM to optimize the JVM heap and garbage collection settings, they reduced CPU usage by 40% and brought response times down to 480ms. This also cut cloud infrastructure costs by 30%.
"Hardware scaling without optimization just burns money faster. Proper tuning delivers sustainable performance." – We LowCode
Additionally, batch data commits can help reduce database strain and stabilize memory usage, ensuring smoother app performance.
Setting Up a Benchmarking Environment
Creating accurate benchmarks means crafting an environment that closely mirrors real-world conditions. Without this, the data you collect might not reflect actual user experiences.
Device and Network Configuration
To get reliable results, it's important to test on a range of devices and network conditions. Include a mix of hardware, like flagship and mid-range Android devices, as well as various generations of iOS devices. Avoid relying solely on a developer laptop, as background processes can skew results. Instead, use dedicated hardware to maintain consistency.
Simulating network conditions is just as crucial. Test your app under different scenarios such as 4G LTE (around 25 Mbps), 5G, high-speed Wi-Fi, and slower 3G speeds (approximately 1.5 Mbps). This helps you understand how the app performs with varying bandwidth and latency. For instance, Google's Lighthouse tool replicates a 2016 Moto G4 on a network representing the bottom 15% of 4G connections, using 1.6 Mbps bandwidth. When testing desktop scenarios, apply a 2× CPU throttling factor for mobile simulations, but skip throttling for desktop tests to maintain accuracy.
Before each test run, reset devices by closing background apps and clearing caches. This ensures every test starts with a "clean slate", providing consistent results.
Once the hardware and network conditions are set, focus on standardizing your test data.
Test Data Preparation
Consistency in test data is key. Seed your database with data that mirrors real production scenarios. This means including realistic user interactions, typical transaction volumes, and high-traffic conditions. Don’t forget to use data masking and pseudonymization to protect sensitive information.
For statistical reliability, aim for these request counts:
- 1,000 requests for p95 accuracy
- 10,000 requests for p99 accuracy
- 100,000 requests for p99.9 accuracy
Additionally, discard data from the first 30 seconds of testing. This accounts for factors like JIT compilation, connection pool setup, and cold caches, which can distort early results.
After preparing your test data, the next step is to define scenarios that reflect how users interact with your app.
Standardizing Test Scenarios
To ensure reproducibility, document all aspects of your test cases. This includes device models, operating system versions, and network configurations.
Set clear Service Level Objectives (SLOs) to measure performance effectively. For instance:
- Page load times under 3 seconds
- Screen transitions within 1.5 seconds
- API responses under 500 milliseconds
Use p95 and p99 metrics to evaluate these targets.
"A benchmark without a hypothesis is just expensive noise." – Sumit Kumar, Senior Software Engineer
Defining these parameters ensures that your benchmarks are not only repeatable but also meaningful.
Running Benchmark Tests
Once your environment is set up and your test scenarios are documented, it’s time to run the benchmarks. The aim here is to assess performance methodically - start with normal conditions and gradually increase the load. This approach helps you understand how your low-code app performs under pressure. Begin by establishing a performance baseline before escalating the load.
Baseline Testing for Performance Metrics
Start by measuring performance under ideal conditions. Include a brief warm-up phase to account for any initialization noise. Track key metrics like load times, memory usage, CPU utilization, and network requests across all target devices.
When analyzing results, focus on percentiles instead of averages. For example, while a 150ms average response time might seem acceptable, a P99 of 8 seconds means that 1 in 100 users faces a poor experience. Aim to collect at least 1,000 requests for P95 metrics and 10,000 requests for P99 metrics.
"A benchmark that doesn't control for warm-up, sample size, and environmental variables produces noise, not data." – ProtocolCodes
These baseline results will serve as a foundation for the next stages: load and stress testing.
Load and Stress Testing
Load testing helps you evaluate how the app performs during expected peak traffic. For example, this could be Black Friday for an e-commerce platform or the end of a quarter for a business dashboard. Start small - say, with 10 virtual users - and gradually ramp up to the anticipated peak load, such as 500 concurrent users. This gradual increase lets you pinpoint when performance starts to degrade.
Stress testing, on the other hand, goes beyond peak capacity to identify the system's breaking point. The goal is to observe how the app handles failure - does it degrade gracefully, or does it crash entirely? Monitor critical metrics like CPU utilization (aim for under 70%), memory usage (under 80%), and error rates (keep them below 0.1%). These numbers matter. For instance, every 100ms of added latency can reduce revenue by 1% for major e-commerce platforms like Amazon, and downtime during peak traffic can cost enterprises as much as $5,600 per minute.
Once load and stress tests are complete, move on to simulating real-world usage with concurrent user testing.
Concurrent User Testing
Testing with multiple users accessing the system simultaneously requires a realistic approach. Simply firing off requests won’t cut it. Incorporate think times, which mimic natural pauses in user behavior. For example, users don’t hit "Submit" immediately - they pause to review their input or get distracted.
Use parameterization to make virtual users behave uniquely. Assign different IDs, search terms, or login credentials to each user. If all virtual users perform the same actions, caching mechanisms may hide potential performance issues.
For low-code apps, browser-driven testing is often more effective than protocol-based testing. Browser-driven tests capture UI rendering times for HTML, JavaScript, and CSS - elements that protocol-based tests might overlook. This provides a clearer picture of the actual end-user experience.
A great example of this is the restaurant delivery service ResDiary, which used GoReplay to capture and replay real production traffic during their migration from RackSpace to Azure. This allowed them to estimate infrastructure needs accurately and identify potential issues in their new setup. Thanks to this approach, they ensured a smooth transition for their UK and Australia regions.
Analyzing Results and Improving Performance
After running your benchmarks, it's time to compare the results against your baseline. This helps you identify deviations - like a jump in P99 latency from 500 ms to 2 seconds - and locate specific bottlenecks. This step lays the groundwork for targeted solutions and measurable progress.
Finding and Fixing Bottlenecks
Start by categorizing issues into UI-related or logic-related problems (e.g., interface glitches versus delays in processing). Debugging tools can break down response time into segments such as "Prepare Query", "Backend (Execute Resource)", "Frontend", and "Response Size", giving you a clear picture of where delays occur.
One common issue to watch for is the N+1 query pattern. This happens when a microflow retrieves or commits data repeatedly inside a loop. This pattern can dramatically increase database operations, with just one or two inefficient flows often causing over 70% of an app's slowdown. Resource spikes are another clue: high CPU usage often points to inefficient loops or overly complex logic, while high memory consumption might suggest memory leaks or commit lists exceeding 10,000 objects.
Here’s a quick guide to common bottlenecks and how to address them:
| Metric | Common Bottleneck | Recommended Fix |
|---|---|---|
| Server Response Time | Complex XPath or missing database indexes | Add indexes, simplify security rules, and use query caching |
| App Load Time | Large JSON payloads or unoptimized images | Optimize payloads, compress images, and implement lazy loading |
| CPU Utilization | Nested loops or heavy synchronous logic | Batch operations and shift logic to asynchronous tasks |
| Memory Usage | Large commit lists or memory leaks | Use batching and run large tasks asynchronously |
| UI Responsiveness | Too many nested data views or widgets | Simplify pages and use pagination for large tables |
"Performance regressions are silent bugs. A database query that used to take 5ms now takes 250ms because someone added a missing index migration that never got written." – ProtocolCodes
Set up alert thresholds to catch regressions early. For example, if your baseline load time is 2.5 seconds, configure alerts for anything exceeding 4 seconds. To ensure accuracy, collect at least 1,000 requests for P95 metrics and 10,000 for P99. With proper tuning, a well-optimized low-code app can manage up to 10× more traffic on the same infrastructure.
Once you’ve addressed immediate bottlenecks, focus on maintaining and improving performance over time.
Continuous Improvement Process
Performance tuning isn’t a one-and-done task - it’s an ongoing process. Set clear success criteria, run experiments, make one change at a time, and repeat. Incorporate benchmarking into your CI/CD pipeline to detect regressions before merging code. A common practice is to fail builds if P99 latency increases by more than 20%. This "shift-left" approach ensures bottlenecks are caught early, before they make it to production. Running weekly regression tests can also help you spot gradual performance dips over time.
"Performance is not a feature. It's a business advantage." – We LowCode
Leverage Application Performance Monitoring (APM) tools like New Relic, AppDynamics, or Datadog to track real-world usage and traffic spikes. For updates, consider canary deployments - releasing changes to a small group first to monitor their impact before rolling out to everyone. Only update your baseline after verifying improvements on your main branch. These insights will help you refine your benchmarks and continue optimizing performance.
Tools and Resources for Benchmarking Low-Code Apps
To maintain and optimize low-code app performance, it's crucial to choose the right benchmarking tools. Many ready-to-use solutions can simplify the process and help you achieve reliable results.
Performance Testing Tools
When it comes to turning performance insights into actionable improvements, certain tools stand out for their real-time monitoring and diagnostic capabilities.
For real-time monitoring, tools like Firebase Performance Monitoring and New Relic automatically track metrics such as app startup time, network requests, and page load speeds. If you're looking to measure raw throughput, lightweight HTTP benchmarking tools like wrk (built in C) and hey (written in Go) are excellent options. For more advanced scenarios, k6 is a great choice for scriptable load testing.
For in-depth diagnostics, platforms like AppDynamics and Datadog excel at monitoring API response times and database query performance, making them particularly useful for server-driven UI setups. If you're aiming for continuous benchmarking within your CI/CD pipeline, tools like Bencher allow you to track performance metrics over time and detect regressions early. For capturing user-perceived performance, browser-driven tools such as HeadSpin and Rigor are better suited than protocol-based alternatives.
Some low-code platforms also include built-in performance tools. For example, Mendix offers a Performance Tool for analyzing microflows and SQL actions, along with Mendix APM for monitoring microflow execution and database latency. Retool, on the other hand, provides a "Performance linter" and a "Debug" mode, which deliver real-time performance scores and query latency breakdowns. Retool calculates performance scores using a combination of p50 and p95 query stats and app size values.
If you're searching for platforms with strong benchmarking capabilities, the Low Code Platforms Directory can help you identify solutions tailored to your needs.
Using the Low Code Platforms Directory
The Low Code Platforms Directory is a valuable resource for finding platforms that prioritize performance metrics. It categorizes platforms into types like No-code, BPM, SaaS-attach, and General Purpose, helping you match your choice to your project's complexity and requirements. For enterprise-grade applications with high traffic and scalability demands, platforms like Mendix or OutSystems - listed under "General Purpose" - are ideal. For simpler projects, such as internal forms, "No-code" platforms may be sufficient.
When browsing the directory, check whether platforms offer native performance tools or support integration with industry-standard solutions like New Relic, Firebase Performance Monitoring, and Datadog. For projects requiring continuous benchmarking, look for platforms with Git integration and automated testing pipeline support. Open-source frameworks like Appsmith and ToolJet are also worth considering, as they provide flexibility for integrating external tools such as JMeter, k6, or Gatling.
Conclusion
Performance benchmarking isn't a one-and-done task - it requires ongoing effort. It begins with establishing clear baselines and involves regular audits to ensure your low-code app performs as expected. As your app evolves and your user base grows, new challenges will arise. The only way to address these effectively is through continuous monitoring to identify and resolve issues before they affect your business.
Big tech companies have shown how latency directly impacts business results. Performance influences everything from user experience to revenue and system reliability. Gartner even estimates that downtime can cost enterprises as much as $5,600 per minute.
When analyzing performance, focus on p95 and p99 metrics rather than averages. Averages can hide critical delays, while these metrics provide a clearer picture of outlier performance. To stay ahead, set strict performance budgets - such as limiting p95 response time increases to no more than 50ms per release - and incorporate automated performance gates into your CI/CD pipeline. This approach helps catch performance regressions early, when fixes are less costly. Running weekly regression tests is another way to ensure new features don't compromise existing performance. These steps are crucial for keeping your low-code application competitive as user needs and technologies shift.
The low-code market is expected to hit $50 billion by 2028, with 70% of new enterprise applications projected to use proprietary low-code or no-code platforms by 2025. As these tools become integral to business operations, continuous and disciplined benchmarking will separate successful implementations from costly missteps. In this rapidly expanding market, staying vigilant about performance benchmarking won't just protect your app's functionality - it will give you a critical edge.
FAQs
How do I set p95/p99 performance targets for my low-code app?
When defining p95 or p99 performance targets, it's essential to ground them in realistic latency budgets that strike a balance between delivering a good user experience and what’s feasible from a technical standpoint. Start by analyzing different page types and user interactions. For example, you might aim for a p95 target of 2,000ms for landing pages or 2,500ms for search result pages.
To make these targets meaningful, focus on measuring critical metrics like load time and responsiveness. Use this data to establish baselines, and then refine your goals over time. The idea is to continuously adjust these targets so they align with both user satisfaction and broader business objectives.
What’s the simplest way to run realistic load tests for a low-code UI?
The easiest way to conduct realistic load tests for a low-code UI is by simulating real user interactions using tools designed to replicate typical workflows. For instance, Locust allows you to script user actions like logging in, navigating through pages, and submitting forms. You can then scale these tests from local setups to distributed environments. This approach helps pinpoint performance issues early, ensuring your low-code interface can manage the expected traffic smoothly.
How can I catch performance regressions automatically in CI/CD?
To spot performance regressions in your CI/CD pipeline, automated tools for performance testing and benchmarking are key. These tools monitor metrics over time, compare them against established baselines, and use statistical analysis to flag any regressions.
Some effective approaches include:
- Continuous benchmarking solutions: These tools run performance tests regularly, offering a clear view of trends and potential issues.
- Integrated CI performance checks: Embedding performance tests directly into your CI pipeline ensures regressions are caught during development.
- Reproducible tests in isolated environments: Running tests in controlled settings helps eliminate variability, making it easier to identify real performance drops.
By catching regressions early, you can maintain your application's efficiency long before it hits production.