Load testing ensures your low-code app performs well under user demand. It identifies system limits, bottlenecks, and potential failures before users experience issues. This process is critical because poor performance can cost businesses thousands of dollars per minute and lead to user abandonment. Here's what matters most:
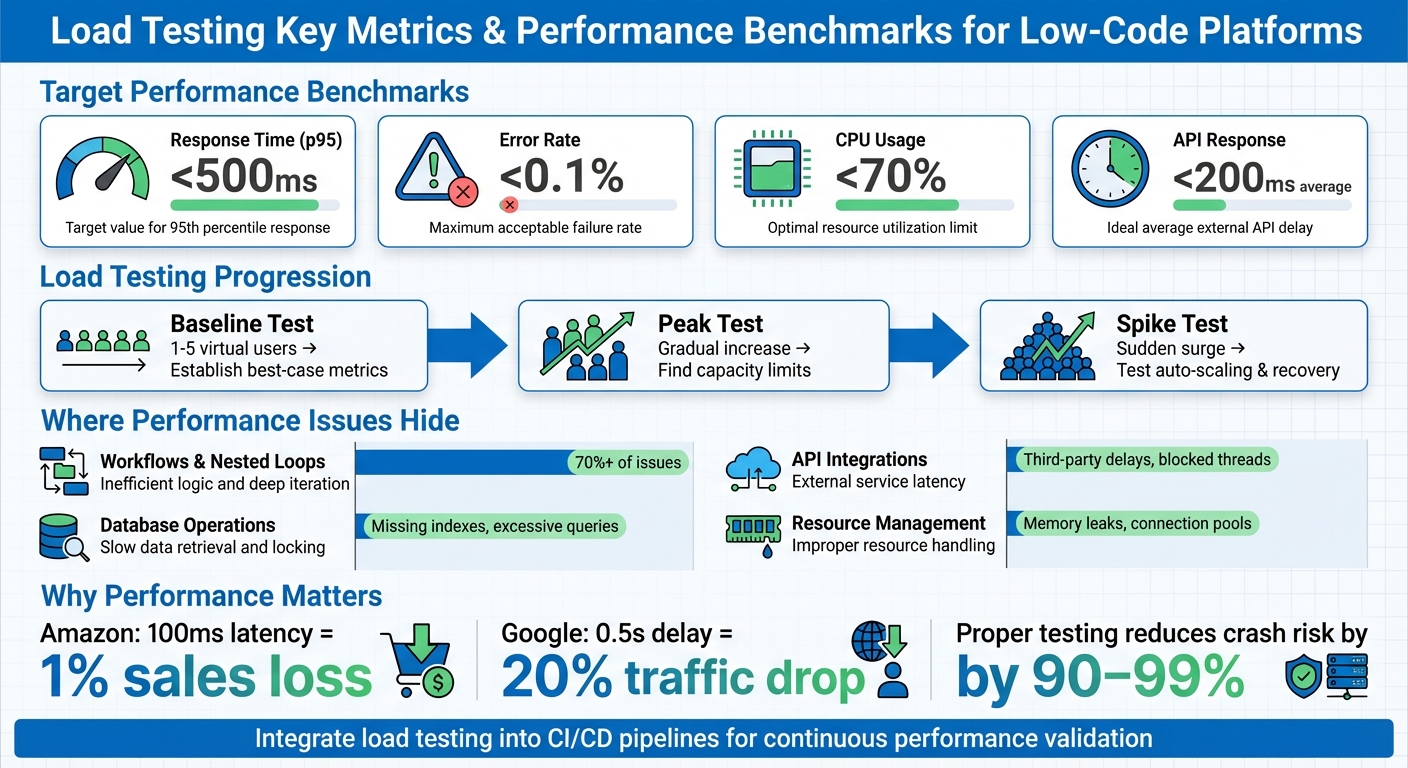
- Key Metrics: Monitor response times (e.g., p95 under 500ms), error rates (below 0.1%), and CPU usage (under 70%).
- Challenges: Many low-code platforms can hide performance issues due to abstraction layers. Common problems include excessive database calls, inefficient workflows, and API delays.
- Preparation: Use realistic test scenarios, staging environments that mimic production, and platform-specific tools to identify issues.
- Execution: Start with baseline tests, then run peak and spike tests to measure capacity and recovery during traffic surges.
- Analysis & Fixes: Focus on percentile metrics (p95, p99) and address bottlenecks like database inefficiencies or misconfigured workflows.
- Automation: Integrate load testing into CI/CD pipelines for continuous validation after updates.
Skipping load testing risks downtime, poor user experience, and lost revenue. Start early, test often, and refine based on results to ensure smooth performance as traffic grows.
Load Testing Key Metrics and Performance Benchmarks for Low-Code Applications
Software Load Testing (How to Get Started)
sbb-itb-33eb356
Preparing for Load Testing in Low Code Platforms
Before diving into load testing, it’s crucial to create an environment that closely resembles real-world usage. These preparations ensure your tests run smoothly and produce results you can trust. Let’s start by establishing clear performance benchmarks.
Setting Performance Benchmarks
First, define what "good performance" looks like for your application. Tie these benchmarks to your business needs and Service Level Agreements (SLAs). For instance, customer-facing transactions should aim for a 95th percentile (p95) response time between 200 ms and 500 ms. This ensures that 95% of users experience smooth load times, rather than just focusing on average response times.
Run baseline tests under normal conditions to document key metrics like response times, throughput (transactions per second), error rates, and resource usage (CPU and memory). This establishes a reference point for comparison. Pay special attention to percentile metrics like p95 and p99, as they highlight the experience of your slowest users - something averages can’t reveal.
In low-code platforms such as Mendix or OutSystems, it’s essential to monitor concurrency limits - the maximum number of simultaneous sessions your app can handle before performance starts to degrade. Platform-specific profiling tools can help uncover issues like excessive database calls. For example, tuning JVM parameters in similar scenarios has reduced response times by up to 80%, lowered CPU usage by 40%, and cut cloud costs by 30% - all without altering code or infrastructure.
"Benchmark testing gives you a reference point to measure application performance before and after optimizations. Without it, improvements are just guesswork." – yamsbar, Performance Engineer
Creating Realistic Test Scenarios
Your test scenarios should reflect how users actually interact with your application. Instead of testing isolated requests, model complete user journeys - like logging in, performing activities, and logging out. Use weighted task modeling to match real traffic patterns. For example, if 70% of users browse products and 30% make purchases, your test should mimic those proportions.
Incorporate think time into your tests. Real users don’t send continuous requests - they pause to read content or fill out forms. For consumer apps, think times of 3 to 12 seconds work well, while internal business tools might use 1 to 5 seconds.
Avoid artificially high cache hit rates by using dynamic test data, such as unique product IDs, user credentials, or form entries, sourced from CSVs or databases. Also, design scripts to mimic human behavior. For instance, if a simulated user fails to log in, the script should stop rather than proceed to complete a purchase.
To calculate the number of concurrent users, you can use one of three approaches:
- Requirement-driven: Based on expected headcounts, with a buffer.
- Transaction-based: Divide peak hourly transactions by transaction duration.
- Analytics-based: Multiply peak hourly visitors by average session duration.
For example, if you anticipate 160 orders per hour and each order takes 5 minutes, you’ll need about 14 concurrent users. Once your scenarios are set, make sure they run in a staging environment that mirrors production.
Preparing a Staging Environment
Testing in production or unrepresentative environments can lead to missed issues. A dedicated staging environment helps catch problems - like configuration mismatches or authentication failures - that might not show up in local builds. It also reveals how the abstracted components of low-code platforms behave under load.
Your staging environment should closely resemble production, including hardware, operating systems, network configurations (like load balancers and CDNs), and resource allocations. Use snapshots of production data, combined with data masking, to maintain testing accuracy while protecting sensitive information. Schedule regular automated refreshes to prevent "environment drift", where staging gradually becomes misaligned with production.
"Think of staging as your dress rehearsal; everything should work exactly like it will in production... but without affecting real users." – Northflank
Low-code platforms often rely on third-party APIs and connectors. Testing these integrations in staging helps identify issues like contract mismatches or latency problems before they affect users. Use the same monitoring tools in staging as you do in production - such as New Relic, AppDynamics, or platform-specific APMs - to spot scaling issues or memory leaks early.
To streamline staging setup and ensure consistency with production, use Infrastructure as Code (IaC) tools like Terraform or Ansible. Parameterize your test configurations so the same suite can run across development, CI, and staging environments without requiring hard-coded adjustments.
Running Load Tests on Low Code Platforms
Once your staging environment is set up and test scenarios are ready, start with a minimal load, gradually increasing the number of users while keeping a close eye on system responses. This approach helps you gather performance data and pinpoint potential bottlenecks for deeper analysis later.
Baseline Testing for Normal Loads
Start with a baseline test using a small load - typically between one and five virtual users. This step establishes your "best case" performance metrics and ensures your application is functioning correctly before introducing stress scenarios. Run these tests under normal traffic conditions to measure how quickly your app responds when resources aren't strained.
For example, if response times jump from 150 ms to 800 ms, you've identified a clear performance drop. Key metrics to track include:
- Average response time: Aim for under 200 ms for APIs.
- p95 response time: Keep it below 500 ms.
- Error rate: Maintain this under 0.1%.
- CPU utilization: Ensure it stays below 70% during sustained operations.
Running Peak and Spike Tests
Once you have baseline metrics, it's time to test the system's limits. Peak tests involve gradually increasing the number of virtual users until throughput levels off, signaling the system's capacity limit.
In contrast, spike tests simulate sudden bursts of traffic by ramping up user counts rapidly. These tests assess how quickly your platform's auto-scaling features react and whether the application can recover from abrupt surges. On low-code platforms like Bubble or Salesforce, performance bottlenecks during spikes are often caused by issues like nested database queries, inefficient workflows, or excessive API calls rather than infrastructure constraints.
"Ideally, load testing should be a part of a regular regression run, as bug fixes can also affect the application's performance. If that isn't feasible, then it should at least be done after every major update." – Michael Tomara, QA Lead, TestFort
Monitoring Performance Metrics
After completing peak and spike tests, focus on monitoring both client-side and server-side metrics. Client-side data highlights what users experience as slow, while server-side metrics (like CPU usage, database logs, and memory consumption) help uncover the root causes. Pay close attention to p95 and p99 latencies to understand how performance affects end-users under stress.
Look out for signs like continuous memory growth, which could indicate a memory leak. For platforms like Mendix, monitoring JVM heap size and garbage collection pauses can prevent disruptive "stop-the-world" events. If critical errors occur, such as login failures, halt the test scripts immediately to avoid skewing results. Additionally, don't just trust "200 OK" status codes - verify response bodies to ensure the application is returning accurate data instead of masking errors with generic success pages.
Analyzing Load Test Results and Fixing Bottlenecks
Reading Key Metrics
When analyzing load test results, focus on percentile response times rather than simple averages. Why? Because averages can mask the true user experience. For example, a system with an average response time of 150 milliseconds might seem fine, but if the p99 (99th percentile) response time is 8 seconds, one out of every hundred users is facing a frustratingly slow experience. To get a clearer picture, track metrics like p95 and p99 (aim for p95 under 500 milliseconds and p99 under 1 second for APIs), error rates (keep these below 0.1% under normal load), and CPU utilization (stay under 70% during sustained operations).
"Averages can be misleading. A system with a 150ms average response time sounds healthy, but if the P99 is 8 seconds, one in every hundred users is having a terrible experience." - LoadForge
Dig deeper into error types - timeouts (caused by system slowness), 5xx errors (indicating application crashes), or 4xx errors (often related to test data or authentication issues) - to validate performance metrics before jumping to conclusions. Pair these metrics with server-side telemetry, such as CPU usage, memory consumption, database query times, and garbage collection pauses. This combination helps pinpoint why performance is lagging.
Finding Performance Bottlenecks
Once you've nailed down the key metrics, the next step is to locate the bottlenecks. In low-code platforms, the usual culprits are workflows, database operations, and integrations. Start by identifying whether the slowdown is happening in the user interface or during workflow execution. Interestingly, many audits reveal that just one or two poorly optimized workflows can account for over 70% of an app's performance problems.
Some common issues include nested loops making excessive database calls, creating too many objects unnecessarily, or committing data inside loops. Database-related problems often involve missing indexes, overly complex XPath or OQL queries, or retrieving large datasets without batching. For integrations, watch out for UI threads being blocked by custom Java actions or delays caused by slow third-party APIs. Even something as small as a missing database index can cause p95 response times to jump from 200 milliseconds to 1,200 milliseconds under load.
Pay attention to how your metrics behave under load. A gradual rise in response times as user numbers grow suggests the system is nearing its capacity. On the other hand, a sudden spike might indicate hitting a hard limit, such as connection pool exhaustion or database locks. Identifying these patterns is critical for planning targeted fixes.
Optimizing and Retesting
Once you've identified the problem areas, it's time to implement fixes. Start with the most impactful workflows, focusing on critical user actions like logins, checkouts, or searches. For database issues, batch commits outside of loops to cut down on I/O overhead. If you're committing large datasets, disable the "Refresh in Client" property to prevent the browser from trying to update thousands of rows at once.
For Java-based platforms like Mendix, optimize heap size settings and choose a Garbage Collection strategy like G1GC to minimize pause spikes and improve overall performance. Here's a real-world example: A logistics company using a Mendix-based tracking app reduced response times from 2.3 seconds to 480 milliseconds and slashed CPU usage by 40%. How? By profiling the app, adjusting JVM settings, and refactoring workflows to batch commits and use asynchronous processing.
After applying fixes, rerun the same test profile to confirm improvements. This step is crucial to ensure your optimizations worked and that you haven’t just shifted the bottleneck to another part of the system.
Adding Load Testing to Development Workflows
Automating Tests with CI/CD Pipelines
Integrating load testing into your development workflow is a smart way to ensure your application consistently performs well. By embedding load testing into your CI/CD pipeline, you can catch performance issues early in the process. Automated tests triggered with each commit or deployment help identify problems before they escalate. Tools like k6, Artillery, and Locust are excellent choices, as they support headless execution and work seamlessly with platforms like GitHub Actions, GitLab CI, Jenkins, and Azure DevOps.
Setting threshold-based quality gates is another key step. For instance, you can configure your pipeline to fail when the 95th percentile (p95) response time exceeds 500 milliseconds or when error rates surpass 1%. A great example of this in action is Olo, a digital ordering platform, which integrated k6 with Grafana in January 2025. This setup allowed their team to monitor real-time test results during live API deployments and quickly address any performance regressions before they reached production. Similarly, Netflix incorporated load testing early in their CI/CD pipelines, which helped them identify performance issues in new microservices and significantly minimize downtime.
For immediate feedback, run smoke tests on every pull request using a small number of virtual users. Then, schedule longer soak tests - lasting six to twelve hours - on a nightly basis to detect issues like memory leaks or resource exhaustion. To streamline your workflow, store load test scripts in the same version control repository as your application code. You can also use environment variables to dynamically pass parameters like target URLs, authentication tokens, and user loads across different environments. These practices lay the groundwork for effective scalability testing.
Repeated Testing for Scalability
Once automated load testing is in place, it’s crucial to retest regularly, especially after any changes or optimizations. Scalability in complex systems often doesn’t follow a predictable pattern. An application that handles moderate traffic well might behave unpredictably under heavy load. That’s why running tests after every optimization is essential to ensure your changes don’t introduce new bottlenecks.
For example, after refining workflows, tuning databases, or adjusting system configurations, rerun your tests to confirm the improvements hold up under pressure. This approach helps prevent shifting bottlenecks and ensures your system remains stable. Testing the most critical user flows can dramatically reduce the likelihood of crashes during high-traffic periods - by as much as 90% to 99%.
Using Low Code Platforms Directory
When choosing a low-code platform for your next project, it’s worth considering whether it offers built-in load testing tools or integrates easily with external performance testing solutions. The Low Code Platforms Directory (https://lowcodeplatforms.org) is a helpful resource for this. It provides a filtering system to identify platforms that align with your needs, including those with native automation and testing capabilities. Using this curated directory can simplify the setup of automated load tests, saving you time and effort while reducing the challenges of integrating third-party tools into your workflow. This streamlined approach makes it easier to incorporate testing into your continuous development process.
Conclusion
Key Points Recap
Load testing plays a critical role in protecting revenue, maintaining customer trust, and safeguarding your brand's reputation. In this guide, we’ve walked through the essentials: creating realistic test scenarios that reflect actual user behavior, running both baseline and peak tests to understand system limits, and analyzing performance metrics to spot potential bottlenecks before they affect users. The main takeaway? Performance isn’t a one-time task - it’s an ongoing commitment to improvement.
To make load testing effective, three factors are essential. First, your tests need to replicate real user behavior, including pauses and unique data payloads. Second, the testing environment must closely resemble production because scalability in complex systems doesn’t follow a straight line. Finally, set measurable goals - like ensuring the 90th percentile response time stays under two seconds with 10,000 concurrent users - so success is clearly defined. When done right, load testing can reduce the risk of crashes during high-traffic events by as much as 90% to 99%. These principles help establish a mindset of continuous performance improvement.
Final Thoughts on Continuous Improvement
The insights shared here highlight the importance of weaving load testing into every stage of your development process. Performance isn’t just something to check off at the end - it’s a key factor in shaping user experience and ensuring your system can handle real-world demands. Consider this: Amazon reported that every 100 milliseconds of latency costs them 1% in sales, while Google found a 0.5-second delay in search results led to a 20% drop in traffic.
To stay ahead, integrate load testing into your CI/CD pipeline. Use regular smoke tests on pull requests, nightly load tests, and weekly soak tests to uncover issues like memory leaks early - when fixes are faster and less expensive. By making performance validation a shared responsibility across your team, you’ll ensure your system stays reliable and delivers the fast, seamless experience users expect. This proactive approach will help your application remain strong as traffic grows and requirements change.
FAQs
How many virtual users should I test with?
The number of virtual users you need depends on your application's peak usage and what you want to achieve with your testing. There’s no magic number - it all comes down to reflecting realistic usage patterns without straining your resources unnecessarily.
Begin by looking at historical data or estimating how many users are likely to be active at the same time. Testing with too few users might overlook potential problems, while testing with too many could lead to wasted time and resources. The goal is to simulate conditions as close to real-world usage as possible for the most reliable outcomes.
What should I do if p95 looks fine but p99 is slow?
If your p95 latency looks good but p99 is lagging, it’s time to zero in on tail latency. The slowest requests often reveal bottlenecks like resource contention or poorly optimized code. To tackle this, run focused load tests and fine-tune performance to pinpoint and resolve these delays.
How do I keep staging performance tests close to production?
To make staging performance tests align closely with production, it's essential to replicate real user behavior and authentic load conditions. This means replaying actual user interactions, using varied data to parameterize scenarios, and setting up environments that closely resemble production. Regular adjustments to configurations, along with mimicking workflows, traffic patterns, and data variability, are key. These steps help uncover bottlenecks and ensure that staging tests provide a reliable picture of production performance.