Query optimization in low-code platforms is all about improving app performance without diving deep into complex coding. These platforms simplify optimization with visual query builders, automated tools like caching toggles, and built-in monitoring dashboards. Here's what you need to know:
- Why It Matters: Slow queries can bottleneck databases, reduce system capacity, and frustrate users. Optimized queries improve load times, cut costs, and boost user retention. For example, replacing
SELECT *with specific columns can reduce data transfer by up to 87%. - How It Works: Low-code tools handle tasks like connection pooling, optimized joins, and caching automatically. Platforms like Retool highlight slow queries and suggest fixes, while others like Mendix track query execution times with built-in tools.
- Key Techniques: Minimize data retrieval by selecting only necessary columns, use server-side filters, optimize joins, and leverage indexing and caching. Cursor-based pagination is preferred for large datasets to avoid unnecessary scans.
- Advanced Strategies: Simplify complex queries by filtering data early, use materialized views for precomputed results, and apply dynamic query re-optimization for changing workloads. Tools like JavaScript transformers and "Query JSON with SQL" help process data efficiently without overloading databases.
- Continuous Monitoring: Platforms like Retool and Quickbase offer performance tracking tools to identify and fix bottlenecks. Regularly review execution plans and monitor metrics like query time and response size to maintain optimal performance.
Analyzing and Diagnosing Query Performance
This section breaks down the key steps for diagnosing query performance issues in low-code platforms.
Identifying Slow Queries
Low-code platforms often come with built-in tools to help spot performance bottlenecks. For instance, platforms like Quickbase and Retool automatically flag slow queries during actions such as report views, record saves, or form loads. Retool takes it a step further with its performance linting feature, which highlights slow query times and offers optimization suggestions like using pagination or caching.
For platforms like Mendix, developers can manually track execution times by inserting timestamps using actions like Create Variable or Log Message. Alternatively, Java actions such as TimeMeasureStart and TimeMeasureEnd can calculate execution times in milliseconds. Setting thresholds like LogMinDurationQuery (e.g., 500 milliseconds) will log any database operations exceeding the set duration.
Some platforms simplify prioritization with grading systems. For example, Cognite assigns grades from A to E, helping developers focus on the most impactful performance issues. Retool, on the other hand, calculates a performance score by comparing query metrics against the p50 and p95 benchmarks from all apps on the platform.
Once slow queries are flagged, the next challenge is understanding how the database processes them.
Understanding Execution Plans
Execution plans provide a detailed breakdown of how a query is processed by the database engine, covering operations like data retrieval, filtering, and joins. This roadmap helps pinpoint inefficiencies, such as whether data transformations are handled at the source (faster) or by the platform’s engine (slower).
Some tools make this process more visual. SingleStore's Visual Explain graphically highlights operator costs and processing paths. Quickbase uses dependency diagrams to map field interactions and calculation counts, with a "hot path" feature that flags fields responsible for over 20% of total calculations.
For example, a reporting query that joined four tables initially took 12 seconds to execute. Using EXPLAIN ANALYZE, developers discovered a bad row estimate - the planner expected 100 rows but encountered 2.4 million. This led to a sequential scan being chosen. After updating table statistics, execution time dropped to just 0.345 seconds, a dramatic 35x improvement.
Once execution plans are decoded, the next step is to measure baseline performance for ongoing optimization.
Measuring Baseline Performance
Baseline metrics are essential for tracking performance improvements over time. Retool’s Query Stats tool breaks down total query time into components like Prepare query, Backend, Frontend, and Response size, helping identify where bottlenecks occur - whether in the database, middleware, or browser.
Key metrics to monitor include execution timing (wall clock time), planner estimates versus actual rows processed, and resource usage (e.g., memory hits versus disk reads). Multiplying actual time by loops provides the true execution cost of a query.
Here’s a real-world example: A logistics company using Mendix found that their app had an average response time of 2.3 seconds and 92% CPU utilization. By profiling the app with APM tools and refactoring microflows to batch commits, they reduced response times to 480ms (a 79% decrease) and cut CPU usage by 40%.
Tracking metrics like "Rows Examined" versus "Rows Returned" can reveal query efficiency. High "Rows Removed by Filter" values suggest that indexes aren’t selective enough. Additionally, monitoring throughput metrics like Transactions Per Second (TPS) helps gauge how performance changes as user load increases.
sbb-itb-33eb356
Key Techniques for Query Optimization
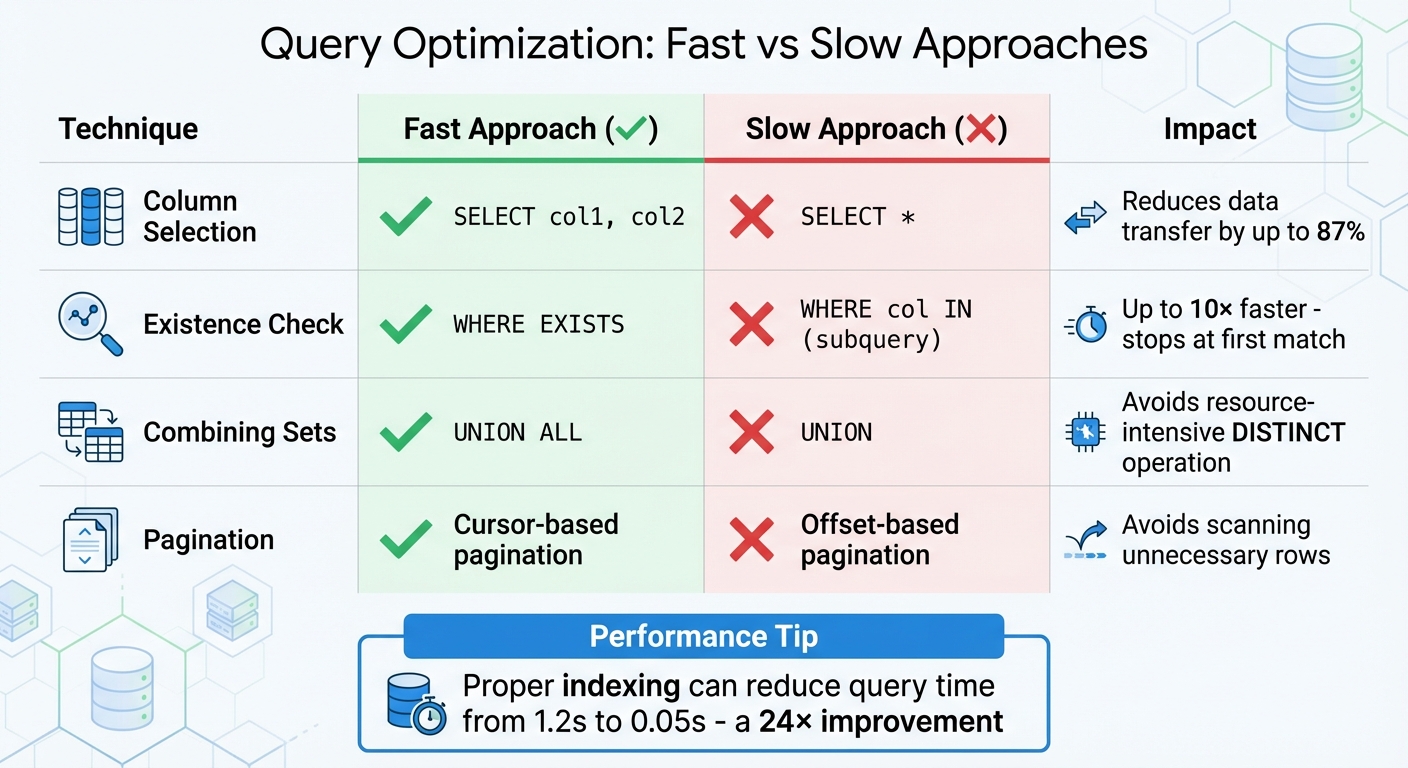
Query Optimization Techniques: Fast vs Slow Approaches Comparison
Once you've identified slow queries and analyzed their execution plans, it's time to implement strategies that improve performance efficiently. These approaches utilize features like visual query builders and automated caching to streamline data processing and enhance response times.
Minimizing Data Retrieval Scope
Instead of using SELECT *, specify the columns you need (e.g., SELECT id, name, email). This reduces the amount of data transferred, which can lower data transfer by up to 87% for tables with many columns.
Use server-side filters with WHERE clauses to limit the data retrieved at the database level, avoiding the inefficiency of fetching thousands of records only to filter them in your application. Platforms like PowerApps benefit from delegable functions, which shift processing to the data source, avoiding performance issues caused by local filtering. Furthermore, caching query results can reduce database load by 70–90%, while compressing query results (via gzip or brotli) can shrink payload sizes by 70–85%.
For large datasets, switch from offset-based pagination to cursor-based pagination to avoid scanning unnecessary rows. Also, steer clear of leading wildcards in LIKE filters (e.g., LIKE '%value') because they disable indexes and force full table scans.
Finally, refining join operations can further improve data retrieval efficiency.
Optimizing Join Operations
Joins are often a performance bottleneck, but they can be optimized with the right techniques. Ensure both sides of a JOIN ON clause are indexed. Missing indexes on foreign keys can lead to slow nested loops or full table scans. Filtering large tables before joining - using subqueries or Common Table Expressions (CTEs) - reduces the number of rows processed during the join.
Choose the most efficient join type for your query. For example, INNER JOIN is generally faster than LEFT JOIN since it processes only matching rows. When checking for existence, prefer WHERE EXISTS over WHERE col IN (subquery), as EXISTS stops at the first match and can be up to 10× faster. Limit the number of tables joined in a single query to 3–4 to avoid exponential resource consumption.
Address the N+1 query problem by using a single JOIN or batching related queries with WHERE id IN (...). Also, ensure join columns have matching data types and collations - mismatches can prevent effective use of indexes. Avoid applying functions like LOWER() or CAST() to join columns, as this negates indexing benefits.
These join optimizations pave the way for leveraging indexing and caching effectively.
Using Indexing and Caching
Indexes are key to improving query performance for read-heavy applications. Focus on indexing columns commonly used in WHERE clauses, JOIN conditions, and ORDER BY statements. For multi-column indexes, place the most selective column first.
Avoid wrapping indexed columns in functions. For example, instead of WHERE YEAR(created_at) = 2026, use a range query like WHERE created_at >= '2026-01-01' AND created_at < '2027-01-01' to ensure the index is utilized. Use tools like EXPLAIN ANALYZE to identify full table scans, which often signal missing or ineffective indexes.
Caching is another powerful tool, especially for read-heavy APIs or stable reference data like categories or country lists. Platforms such as Retool enable query result caching with a configurable TTL (time-to-live), allowing shared access across your organization. Similarly, DreamFactory supports caching at the API gateway using tools like Redis or Memcached. To avoid serving outdated information, programmatically invalidate caches when the underlying data changes. Stable reference data can be cached for longer periods, while user-specific data should have shorter cache durations.
| Technique | Faster Approach | Slower Approach | Reason |
|---|---|---|---|
| Column Selection | SELECT col1, col2 |
SELECT * |
Reduces data transfer, memory, and I/O load |
| Existence Check | WHERE EXISTS |
WHERE col IN (subquery) |
Stops at the first match; IN processes the entire subquery |
| Combining Sets | UNION ALL |
UNION |
UNION performs a resource-intensive DISTINCT operation |
| Pagination | Cursor-based pagination | Offset-based pagination | Offset pagination requires scanning previous rows |
Advanced Query Optimization Strategies
Once you've got the basics down, it's time to step up your game with more sophisticated query optimization techniques. These advanced strategies build on earlier concepts to help you squeeze even more performance out of your queries.
Simplifying Complex Queries
Breaking down complex queries into smaller, manageable parts can lead to better performance. The secret? Filter data as early as possible in the process. By eliminating unnecessary rows upfront, you save your system from wasting resources on irrelevant data. Instead of running complex joins or lookups directly in a low-code platform, consider creating a consolidated view on your database server. This approach reduces the need for multiple queries and significantly cuts down processing time.
Low-code platforms often use query folding, where your visual transformations are converted into the native language of your data source (like SQL). This lets the database engine handle the heavy lifting instead of your application. For instance, Power Query employs "lazy evaluation", which optimizes workflows by testing transformations on a sample of about 1,000 rows during design, rather than the entire dataset. When working with joins, always rely on unique identifiers (like IDs) instead of text-based codes for faster performance. Additionally, save costly operations - like sorting or data type changes - for the end of your query pipeline to maximize efficiency.
Dynamic Query Re-Optimization
Modern platforms now take query optimization to the next level by dynamically adjusting to live workloads. These systems automatically tweak execution plans based on data volume and usage patterns, ensuring consistent performance even as workloads fluctuate. AI-powered optimizers have made this process largely hands-off, while automated tuning systems adapt in real time.
For example, platforms like Prisma use automatic batching with dataloaders. This technique groups multiple unique queries into a single database request, drastically reducing round-trips. You can also apply dynamic filtering using system-provided SQL parameters (like @_username or @_userRoles) to filter data at the database level based on the active user's context. In high-performance scenarios, setting relation load strategies to "join" ensures only one query runs against the database. Additionally, replacing subqueries with JOIN operations and using "Auto-fill" features to define query outputs can improve both visualization and performance.
Using Data Transformation Tools
Built-in transformation tools are a game-changer for manipulating data without overloading your database. For example, platforms like Retool offer JavaScript transformers, which let you write custom code to filter or format data in real time. However, heavy logic should always be moved to the backend to avoid slowing down your user interface. Another handy feature is "Query JSON with SQL", which allows you to run SQL statements on existing JSON data from previous queries - no need for extra database requests.
For read-heavy workloads, materialized views are a powerful option. These precompute complex aggregations, cutting execution times from minutes to seconds. Server-side scripting tools, like those in DreamFactory, allow you to rewrite queries and apply custom optimization logic before the data reaches the client. Advanced query editors also let you write raw SQL to generate PostgreSQL Views, which can be fine-tuned using specific database functions like citext for case-insensitive filtering. To further streamline performance, use "Transform results" settings to filter data at the resource level instead of the component level. For pagination, switch to keyset (cursor-based) pagination instead of OFFSET pagination to maintain consistent performance, no matter how deep into the dataset you go.
| Tool/Technique | Primary Benefit | Best Use Case |
|---|---|---|
| JavaScript Transformers | Reduces server round trips | Real-time data filtering and formatting |
| Query JSON with SQL | Manipulates existing data sets | Combining results from multiple queries |
| Materialized Views | Speeds up complex aggregations | Read-heavy workloads with stable data |
| Server-Side Scripting | Rewrites queries | Complex transformation logic |
These advanced tools and techniques complement earlier strategies like indexing and caching, giving you a full toolkit to continually improve query performance.
Monitoring and Continuous Improvement
Query optimization isn't a one-and-done task - it’s an ongoing effort. As data grows and user needs evolve, yesterday’s solutions might not hold up tomorrow. That’s why monitoring and refining performance in low code environments is crucial to keeping things running smoothly.
Setting Up Monitoring Practices
Most low code platforms come equipped with tools to help you track query performance without needing extra software. For instance, Retool includes a "Debug > Performance" tab that shows query latency and execution timelines. Similarly, Quickbase offers a Performance Analyzer, which breaks down time spent on filters, fields, and notifications.
Start by defining performance thresholds. For example, set alerts for queries taking longer than 0.05 seconds (50 milliseconds) to address bottlenecks before they impact users. Key metrics to monitor include:
- Total page generation time
- Database query time
- Number of queries per action
- Response data size
Even small improvements can make a big difference. For example, shaving off just 0.1 seconds from load times can result in an 8.4% boost in conversion rates.
A real-world example: In February 2026, a global manufacturing client working with We LowCode adjusted their Mendix runtime connection pooling settings. This tweak led to an 18% increase in throughput - without touching the application code. For larger systems, consider third-party tools like New Relic or AppDynamics to get a more comprehensive view of your application’s performance.
Iterating on Optimization Strategies
Optimization starts with understanding the current state of your application. Use profiling tools to gather baseline data on load times, response times, and error rates. A quick tip: profile your app for 15 minutes each sprint to catch issues early. Often, one or two poorly optimized workflows are responsible for the majority of slowdowns.
As your data grows, database optimizers might handle queries differently. Regularly review execution plans to ensure indexes are still being used effectively. Keep an eye on high-level metrics like p50, p95, and p99 response times to gauge how slower user experiences are trending.
"Performance is not a feature. It's a business advantage." - We LowCode
Incorporate load testing into your development pipeline using tools like Apache JMeter or k6. These tools simulate real-world traffic to identify potential issues before deployment. For deeper insights, platforms like Adalo offer AI-powered diagnostics (e.g., X-Ray) to uncover workflow bottlenecks or components that drain resources unnecessarily. These tools can help you maintain peak performance as your application scales.
Using Low Code Platforms Directory
To keep performance optimized, choose platforms with advanced monitoring tools. The Low Code Platforms Directory is a great resource for comparing these features. For example, you can evaluate Retool's "Performance Score" against Cognite's Debug Notices and Execution Plans. The directory also highlights platforms offering automated performance linters, which suggest fixes like adding pagination or caching to resolve slow queries.
Some platforms go even further with backend visibility. For instance, Mendix provides an Application Performance Monitor (APM), while DreamFactory focuses on connection pooling and relationship handling. Whether you need tools for benchmarking p95/p99 latency or advanced options like JVM tuning and asynchronous query processing, the directory helps you find a platform tailored to your project’s needs.
Conclusion
By using the techniques outlined here, you can create a high-performance application that stands up to the demands of modern users. Query optimization in low-code platforms isn’t a one-time task - it’s an ongoing effort that should be part of every sprint. From analyzing slow queries with tools like EXPLAIN ANALYZE to leveraging strategic caching and indexing, these methods lay the groundwork for applications that are both fast and reliable at scale.
The impact of these strategies can be dramatic. For example, proper indexing can slash query execution times significantly - cutting them from 1.2 seconds to just 0.05 seconds, a 24x improvement. Even small gains matter: a mere 0.1-second improvement in load time can increase conversions by 8.4%, improving both user satisfaction and cost-efficiency.
"In the low-code era, speed of delivery is no longer enough. Speed of experience is what defines success." - We LowCode
Stick to the essentials: avoid using SELECT *, resolve N+1 query issues, use keyset pagination for large datasets, and offload heavy tasks to asynchronous processes. While low-code platforms simplify development, achieving top-tier performance still requires attention to details like JVM settings, connection pooling, and caching layers.
If you’re looking for platforms with built-in monitoring and optimization tools, check out the Low Code Platforms Directory. Whether you need features like APM tools, automated performance linters, or advanced debugging capabilities, this resource can help you find a platform that meets your performance goals. Continuous improvement is the thread that ties together all the techniques discussed here, ensuring your application remains fast and reliable as it scales.
FAQs
What’s the fastest way to find my slowest queries in a low-code app?
The fastest way to spot slow queries in a low-code app is by using the platform's built-in tools or database profiling methods. Start by reviewing query logs or analyzing execution plans. Commands like EXPLAIN can provide detailed insights into how queries are processed. Many platforms also include diagnostic features, such as Query Insights, to identify and evaluate queries that consume excessive resources. These tools make it easier to locate and resolve performance issues efficiently.
How do I choose between indexing, caching, and rewriting a query?
Choosing the right approach - indexing, caching, or rewriting a query - largely depends on what your database needs to perform effectively:
- Indexing is ideal when you need quicker searches or filtering, especially in large datasets where scanning everything would slow things down.
- Caching works best for queries that are run repeatedly or when the data doesn't change frequently, saving time by reusing stored results.
- Query rewriting is helpful when you want to streamline complex logic or make a query run more efficiently.
In many cases, using a combination of these methods can deliver the best performance outcomes.
When should I switch to cursor-based (keyset) pagination?
When dealing with large datasets or navigating through deep pages, cursor-based pagination is a smarter choice. It ensures fast, consistent data retrieval, making it perfect for use cases like infinite scrolling, feeds, or search results. Unlike traditional offset pagination, which tends to slow down as page numbers grow, cursor-based pagination keeps response times stable. This approach minimizes resource usage and avoids performance hiccups, especially when working with massive tables containing over a million rows or requiring extensive pagination depth.