Proprietary low-code platforms make app development faster and easier, but their abstraction layers can hide performance issues. To ensure smooth, reliable apps, focus on tracking these key metrics:
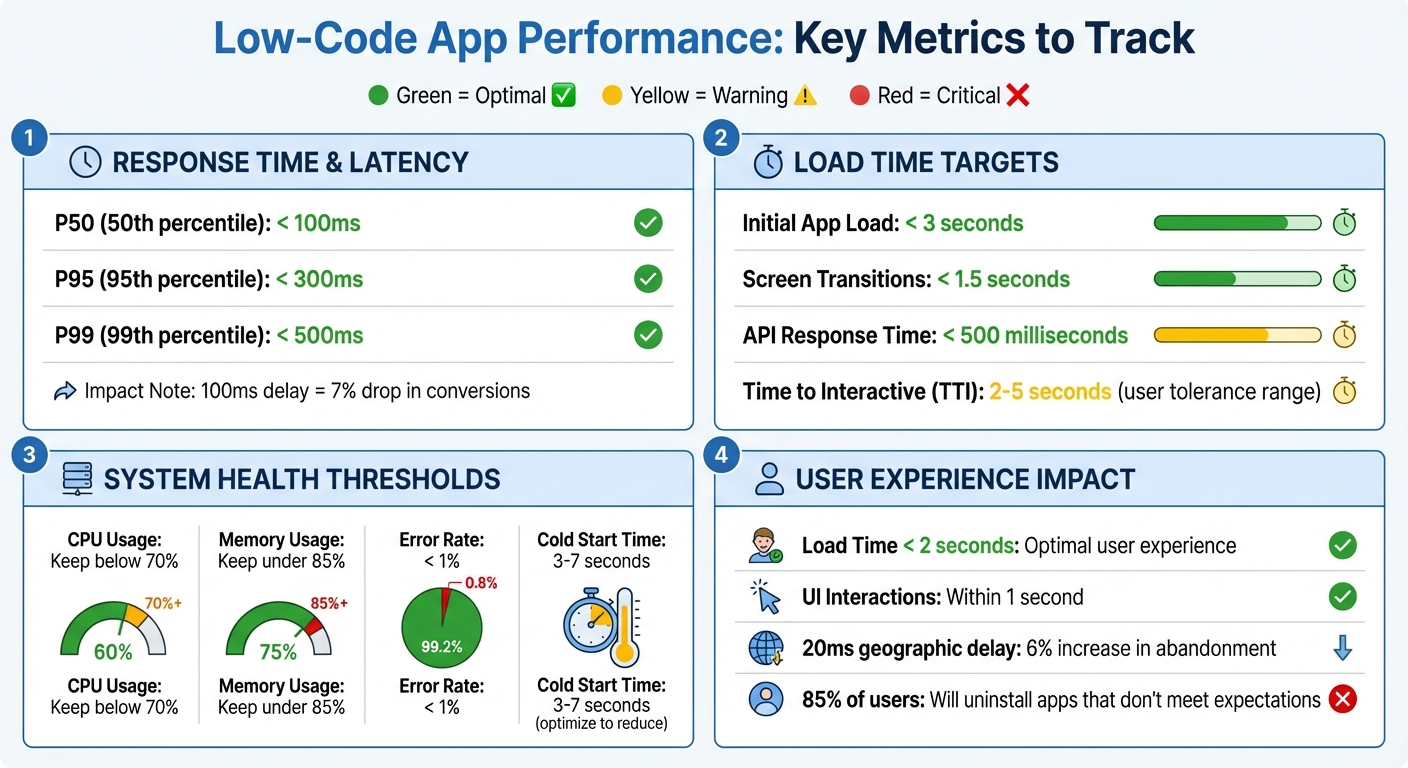
- Response Time & Latency: Aim for P50 under 100ms, P95 under 300ms, and P99 under 500ms. Monitor Time to Interactive (TTI) and Time to Full Load (TTFL) to identify bottlenecks.
- Throughput & User Load Handling: Measure how many requests your app can handle per second. Keep CPU usage below 70% and memory usage under 85% to avoid slowdowns.
- Cold Start Time: Minimize delays during app startup by optimizing initial logic and reducing unnecessary data calls.
- Error Rates: Maintain error rates below 1%. Track exceptions and HTTP error codes to catch problems early.
- Resource Utilization: Monitor CPU, memory, storage, and bandwidth usage to balance performance and costs.
Use tools like Power Apps Monitor, Datadog, or New Relic for tracking. Set automated alerts for performance dips, and regularly test for scalability under high traffic. By focusing on these metrics, you can deliver faster, more reliable apps with better user experiences.
Low-Code App Performance Metrics: Target Benchmarks and Thresholds
Core Metrics to Track in Low-Code Applications
Response Time and Latency
Response time refers to how long it takes for a system to respond to a user's request, from start to finish. In low-code applications, this includes key metrics like Time to Interactive (TTI) - when a screen becomes usable after loading, Time to Full Load (TTFL) - when all data requests are complete, and data request latency, which is the average time for data requests during a session.
Even a small delay can have a big impact. For instance, a 100-millisecond lag can lead to a 7% drop in conversion rates. Similarly, a delay of just 20 milliseconds due to geographic distance can increase user abandonment by 6%. To identify performance issues, track response time percentiles (P50, P95, P99). A good target is P50 under 100 milliseconds, P95 under 300 milliseconds, and P99 under 500 milliseconds.
Low-code platforms can add latency through abstraction layers or database schemas that aren’t optimized for indexing. Additionally, API throttling during high-traffic periods can create bottlenecks. Many free low-code platforms offer tools to monitor performance: for example, Power Apps includes a "Monitor" tool for tracking TTI and TTFL, while Retool's "Query Stats" provides detailed breakdowns of query preparation, backend execution, and frontend rendering times. For more advanced monitoring, third-party tools like Azure Application Insights, Datadog, or New Relic can provide deeper insights.
While response time focuses on individual interactions, system throughput gives a broader view of how well the app handles growing demands.
Throughput and User Load Handling
Throughput measures how many requests your application can handle per second, giving insight into its overall capacity. While response time captures the speed of individual actions, throughput reveals whether your infrastructure can manage increasing user loads. Initially, throughput rises with user activity but drops sharply when system resources - like CPU or memory - become overburdened, often at thresholds like 70% CPU usage.
"Throughput reveals how much work your application can handle overall." - SigNoz
High user concurrency can strain database connections and API rate limits, sometimes causing abrupt failures rather than gradual slowdowns. Native apps often perform better under heavy loads due to lower overhead. Poor performance can have serious consequences - 85% of U.S. users will uninstall an app if it doesn't meet their expectations. To meet user demands, aim for load times under 2 seconds, UI interactions within 1 second, and API responses under 200 milliseconds. Regularly monitor throughput alongside CPU and memory usage, setting alerts for when CPU usage exceeds 70% or memory usage goes above 85%. Simple strategies like caching and batching API requests can help reduce server strain during peak traffic.
Cold Start Time
Cold starts happen when no active container is available to handle a request, leading to extra delays that can range from 3 to 7 seconds - or longer. These delays can test users' patience, as most people tolerate wait times between 1 and 5 seconds, but delays nearing 10 seconds often result in task abandonment. Startup routines, like complex formulas or immediate data calls, can make this issue worse.
"App.OnStart durations impact end-user wait times to access an app. Evaluate simplifying Power Fx in App.OnStart and moving some Power Fx to App.Formulas." - Microsoft Power Platform Documentation
To reduce cold start times, streamline your startup logic. Move non-essential code to run asynchronously in the background. Keep the number of controls on the initial screen low - ideally fewer than 15 - to avoid rendering delays. Using server-side caching and minimizing the amount of data transferred during startup can also make a big difference. Tracking TTI and TTFL can help pinpoint which parts of the startup process are causing delays. By refining cold start processes, you can maintain the fast, seamless experience users expect after optimizing response times and throughput.
sbb-itb-33eb356
Power Platform Performance Monitoring with Nathan Rose & Keith Atherton
For more actionable advice, check out these tips to optimize low-code app performance to ensure your solutions remain responsive.
Advanced Metrics for Scalability and Stability
Once you've nailed down the basics of performance metrics, it's time to dig deeper. Advanced indicators give you a clearer picture of how low-code apps handle stress and help you analyze performance beyond just response times.
Scalability Under Increased Workloads
Throughput measures how many requests your system can handle per second. If you're hitting maximum throughput consistently, it's a sign that your infrastructure might need an upgrade. Concurrency, on the other hand, tracks how many users or processes can run at the same time without dragging down performance.
Another key metric is the peak load threshold - the point where adding more users starts to slow things down. Stress tests are a great way to find this limit. By gradually increasing the number of users until performance dips, you’ll know when to scale up resources. Then there’s the Apdex Score, which measures user satisfaction on a scale from 0 (poor) to 1 (excellent). Transactions are classified as "Tolerating" if they’re between the target response time and four times that target, and "Frustrated" if they take even longer.
For apps built on a low-code development platform, keeping an eye on connector and API performance is a must. Delays in external services - like Dataverse API calls - can slow everything down. Exporting platform data to tools like Azure Application Insights can give you a full view of your system’s health, covering all components.
Beyond just user limits, hardware resources also play a huge role in understanding scalability.
Resource Utilization Metrics
Keeping tabs on CPU, memory, storage, and bandwidth usage can tell you if your app is underpowered (hurting performance) or overpowered (wasting money). For instance, if CPU usage stays above 70%, you’re likely to see performance issues. Similarly, keeping an eye on disk I/O and IOPS helps you measure how quickly storage can respond to demands .
"The performance data that instrumentation gathers can provide valuable insights into the resource requirements of a workload. This information can inform your decisions about planning capacity and allocating resources." – Microsoft Power Platform Documentation
To go deeper, you can embed custom trace events that capture resource usage during critical operations. This helps pinpoint what’s causing spikes in CPU or memory usage. And as mentioned earlier, limiting control counts on individual screens to under 15 can help avoid high memory usage and sluggish navigation. Be aware that frequent garbage collection in resource-heavy apps can cause temporary freezes.
Automated alerts are your safety net. Set them up to trigger when resource thresholds are crossed - like CPU usage exceeding 70% or memory usage going over 85%. This way, you can address performance issues before they escalate. Don’t forget to monitor external dependencies, as issues with APIs or third-party services can ripple through your entire app.
Error Rates and Crash Monitoring
The error rate shows the percentage of failed requests out of the total. Spikes in this metric can be an early warning sign of bigger problems down the road. Since users notice errors more than anything else, high error rates directly affect trust and satisfaction .
"The last thing you want your users to see are errors. Monitoring error rates is a critical application performance metric." – mwatson, Stackify
Track both logged exceptions (errors you’ve caught and recorded) and thrown exceptions (all errors, even the ones ignored). Unhandled errors can still eat up CPU cycles and create hidden bottlenecks . For platforms like Power Apps, metrics like App Open Success Rate (successful launches) and Data Request Success Rate (successful API calls) are great indicators of stability .
Different error codes can tell you different stories. For example, if more than 5% of failed data requests return an HTTP status of 0, network issues or temporary failures might be the cause. A 5% failure rate with HTTP 429 errors suggests throttling - time to reduce data calls. HTTP 403 errors? Check your permissions and app-sharing settings. Use correlation IDs to trace transactions through complex workflows for easier debugging.
Time to Restore (RTO) measures how quickly you can bounce back from issues, showing how efficient and resilient your response process is. Just like response times, keeping error rates low builds trust and reliability. For web-based low-code apps, schedule HTTP ping checks every minute to monitor availability and spot issues early.
Benchmarking Low-Code App Performance
Creating a Benchmarking Framework
Start by defining performance goals that match what users expect. For apps with interactive features, quick response times are essential. On the other hand, server-driven UIs should focus on server response times and how efficiently data is handled. This framework becomes the foundation for testing performance under practical, everyday conditions.
Establish a consistent testing setup that works across various devices and network types using low-code development tools, like 4G LTE, 5G, high-speed Wi-Fi, and even slower 3G connections. Begin by measuring baseline performance in ideal conditions. Then, simulate high traffic by testing with multiple users at the same time.
Keep tabs on live performance using tools like New Relic, Datadog, or Firebase. For example, if your tests show an average load time of 2.5 seconds, you might set alerts for when production load times hit 4 seconds or more. Running weekly regression tests can help catch performance issues introduced by new updates. Tracking the 95th percentile response times is also useful for identifying problems that might only impact a smaller group of users.
Industry Standards for Low-Code Performance
Industry benchmarks help validate your performance goals and provide clear targets to aim for. Key standards include keeping the initial load time under 3 seconds, screen transitions within 1.5 seconds, API responses within 500 milliseconds, and error rates below 1%.
"Throughput gains meaning when correlated with response times, error rates, deployments, or analytics".
This highlights why it’s important to look at multiple metrics together to get a complete view of your app’s performance.
Here’s a breakdown of the main performance targets based on industry standards:
| Metric | Target Benchmark | Context |
|---|---|---|
| Initial App Load Time | < 3 seconds | From launch to fully interactive |
| Screen Transition Time | < 1.5 seconds | Feedback when switching between screens |
| API Response Time | < 500 milliseconds | Time for server-side processing |
| Error Rate | < 1% | Overall stability of the app |
| Time to Interactive (TTI) | 2–5 seconds | Delay users can tolerate while staying engaged |
Tools and Resources for Performance Monitoring
Using the Low Code Platforms Directory
The Low Code Platforms Directory is a handy resource for developers looking to find platforms with built-in performance monitoring features tailored to their specific project needs. Its filtering system allows you to search for platforms based on functionality, such as AI, automation, CRM, or app building. When comparing options, focus on essential factors like observability, scalability, and integration with third-party Application Performance Monitoring (APM) tools. For instance, platforms supporting server-driven UI architectures can deliver instant performance updates without requiring app store releases. Additionally, platforms that integrate natively with tools like Datadog or New Relic enable more detailed distributed tracing across multiple services.
The directory also highlights platforms with diagnostic features. For example:
- AppSheet: Tracks metrics like table read times and virtual column efficiency.
- Power Apps: Monitors Time to Interactive (TTI) and Time to First Load (TTFL) at the 75th percentile using its Monitor tool.
- OutSystems: Combines native analytics with AI-driven insights through its OutSystems Mentor feature.
While native tools often provide solid monitoring capabilities, third-party APM solutions can enhance your insights by covering additional layers of your tech stack. These tools help track critical performance metrics like TTI, throughput, and error rates, ensuring your low-code application aligns with industry benchmarks.
Third-Party Performance Monitoring Tools
Third-party APM tools are invaluable for real-time tracking of response times, throughput, error rates, and resource utilization. Popular options like New Relic, Datadog, and Firebase Performance Monitoring support OpenTelemetry, offering vendor-neutral instrumentation.
Platforms like Retool and OutSystems allow integration with Datadog and Sentry for advanced features like distributed tracing and flame graphs. However, these integrations are usually part of Enterprise Premium plans. For server-driven UI applications, Datadog excels in monitoring API response times and database query performance. Meanwhile, Firebase simplifies performance tracking by automatically monitoring app startup times and HTTP/S network requests - no manual setup required.
When choosing APM tools, look for those that provide percentile-based latency tracking (e.g., P95, P99) instead of relying on simple averages, which can mask poor user experiences. Automated alerting is another critical feature to consider. For instance, a tool should be able to trigger alerts when load times exceed 4 seconds if your baseline is set at 2.5 seconds.
"The DevOps capabilities of OutSystems, like one-click deployment and performance monitoring, mean the apps we deliver this way are less costly to update and maintain".
Conclusion
Monitoring key performance metrics is essential to ensure low-code apps run efficiently and meet user expectations. Metrics like app load time (under 3 seconds), API response time (below 500 milliseconds), and Time to Interactive (TTI) have a direct impact on user satisfaction and retention. At the same time, tracking stability metrics such as error rates and CPU usage (ideally staying below 70%) helps identify and address problems before they escalate into major issues.
Establishing baselines and conducting regular regression tests are crucial for validating performance improvements and avoiding bottlenecks caused by new features. Automated alerts, like notifications when load times exceed 4 seconds if the baseline is 2.5 seconds, enable teams to respond quickly to performance dips. These strategies also play a key role in selecting the right platform for your needs.
The Low Code Platforms Directory can help simplify platform selection by filtering for features like observability, scalability, and integration that align with your performance goals.
"You can understand an application's overall health by monitoring the most critical performance metrics, such as error rate, traffic volume, response time, throughputs, resource use and user satisfaction." - Joydip Kanjilal, Developer and Author
Pay special attention to critical flows - those high-traffic or high-revenue paths that are most important to your business. Combining platform-native tools with third-party monitoring ensures comprehensive visibility into performance. Additionally, addressing technical debt through actions like refactoring code and optimizing queries can further enhance app stability and responsiveness.
FAQs
Which performance metrics should I prioritize first for my low-code app?
To ensure your low-code application delivers a smooth and enjoyable user experience, it's important to keep an eye on a few critical metrics:
- App Load Time: Users expect apps to load quickly. Long load times can lead to frustration and even abandonment.
- UI Responsiveness: A responsive interface keeps interactions seamless and ensures users don't feel delayed or stuck while navigating.
- Error Rates: High error rates can damage trust and usability. Monitoring and minimizing these is key to maintaining reliability.
These metrics aren’t just numbers - they reflect how your app performs in real-world conditions, directly affecting user satisfaction and retention.
How do I set realistic performance baselines and alert thresholds?
To establish practical baselines and alert thresholds for low-code apps, begin by pinpointing critical metrics such as load time, responsiveness, server response time, and error rates. Track performance under normal operating conditions to create accurate baselines.
When setting thresholds, determine acceptable variations. For example, you might trigger alerts if load times exceed 2 seconds or if error rates climb above 1%. Continuously monitor and fine-tune these thresholds based on updated performance data to ensure the app runs smoothly.
What causes slow screens or long cold starts in low-code apps?
Slow performance in low-code apps, such as sluggish screens or extended cold starts, often stems from a few common culprits. These include the time it takes to deploy dependencies, delays in pod allocation, scheduling bottlenecks, or inefficient resource allocation. Together, these factors can drag down app performance, leading to longer startup or loading times.